
Table of Contents
- Executive Summary
- Transit Enhancement Toolbox
- Public Outreach & Stakeholder Engagement
- Project Identification
- Project Recommendations
- Implementation & Next Steps
- Appendices
Published April 2024
Executive Summary
Introduction
The purpose of the Transit Enhancement Program is to improve mobility and access to opportunity for Austin residents and visitors by fostering collaborative relationships with public transit providers, working directly with communities to understand needs and opportunities, and systematically enhancing areas within the built environment to support transit.
The Transit Enhancement Program formed out of the Transit Priority Working Group, a coalition of staff from Austin Transportation and Public Works (TPW) and CapMetro who have been developing and implementing small-scale infrastructure projects to improve transit speed, reliability, safety and access since 2015. In 2018, the City of Austin and CapMetro executed an interlocal agreement (ILA) that commits $1 million per year towards these transit improvement projects, and in 2020 Austin voters approved $460 million in bonds for transportation infrastructure improvements, including $19 million for Transit Enhancement projects.
This report describes the process that TPW staff, in coordination with CapMetro, used to identify 37 recommended transit infrastructure improvement projects within the city of Austin. The $53 million in improvements recommended by this report are anticipated to be funded by 2020 Mobility Bond funds, CapMetro ILA funds, and potential future grant and bond funding opportunities.
Project recommendations were informed by those who know Austin’s bus system best: current transit riders. Over 1,400 community members were engaged in-person and online in Fall 2022 and Spring 2023. During each round of engagement, ten outreach events were held in person at transit stops, where surveys were collected and feedback mapped regarding the public’s transit-riding experience. Each round of engagement also included an identical online survey as well as a web-based mapping tool where participants geolocated their comments. In addition, the project team conducted in-person interviews with CapMetro bus operators to gain insights into recurring operational issues. The feedback gathered in-person and online was critical to the development of this report and directly informed project recommendations.
Policy Background
In 2019, Austin City Council unanimously adopted the Austin Strategic Mobility Plan (ASMP), the City’s comprehensive multimodal transportation plan that guides transportation decision-making citywide. The ASMP envisions a transportation network that is safe, accessible, reliable, provides choices, and serves the diverse needs of the Austin community. Foundational to the recommendations of the ASMP is a 50/50 mode share goal, which will allow the City to manage growth and congestion while supporting other community values like sustainability and affordability by shifting more trips to non drive-alone modes, including transit.
Making transit an attractive alternative to driving requires the City and our public transit partners to work together to create an experience that attracts and retains riders. The 37 projects recommended by this report will take meaningful steps towards achieving the vision of the ASMP by investing in infrastructure that enhances the speed and reliability of local bus service, and makes that service safer and easier to access. By working with our partners, the City can help make public transit a more viable travel option, moving Austin and the region towards a complete public transportation system that is a true alternative to driving.
Report Development Process
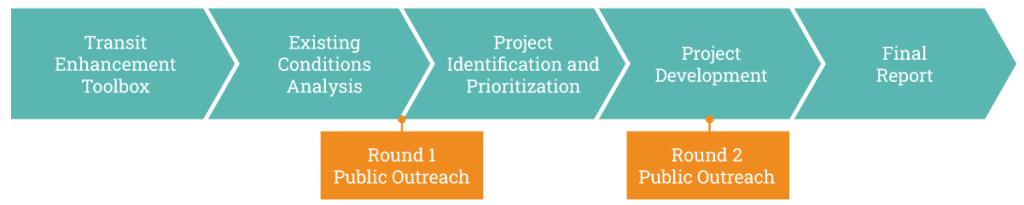
The 37 transit enhancement projects recommended in this report were developed as a result of a deliberative, step-by-step process:
Transit Enhancement Toolbox: First, the Transit Enhancement Toolbox was developed. This is a collection of potential capital and operational treatments that can be applied in Austin to improve transit speed, reliability and access, and create safer, more predictable interactions between transit and other travel modes. The full Transit Enhancement Toolbox is found in the appendix to this report.
Existing Conditions Analysis: Next, existing conditions were analyzed through a data-driven process using the Bus Delay Analysis Tool (BDAT).
The BDAT is a web-based dashboard that analyzes and displays a variety of data related to the transit network, including bus operating speeds and passenger ridership, roadway infrastructure, and community demographics.
Public Outreach & Stakeholder Engagement: Two rounds of in-person outreach were performed at bus stops across the city. The first round occurred in Fall 2022 and the second in Spring 2023. Digital outreach was also deployed during each round of engagement. In-person interviews with bus operators and regular meetings with a Technical Advisory Group composed of City of Austin, CapMetro, and Austin Transit Partnership staff also informed the study.
Project Identification and Prioritization: Through a data driven process using the BDAT and community priorities expressed during the pubic outreach process, a total of 30 locations were identified as having high needs for transit speed, reliability, safety, and access improvements. Several locations were later subdivided further, therefore the final number of project locations totals 37.
Project Development: Planning-level infrastructure improvements were developed for each of the 37 project locations. The proposed enhancements were pulled from the Transit Enhancement Toolbox and were evaluated using data from the BDAT and feedback received from public outreach and stakeholder engagement.
Final Report: Potential funding sources and next steps were identified to move the proposed projects into design and construction, and the results of the study were compiled into a final summary report.
Report Development
Public Outreach & Stakeholder Engagement
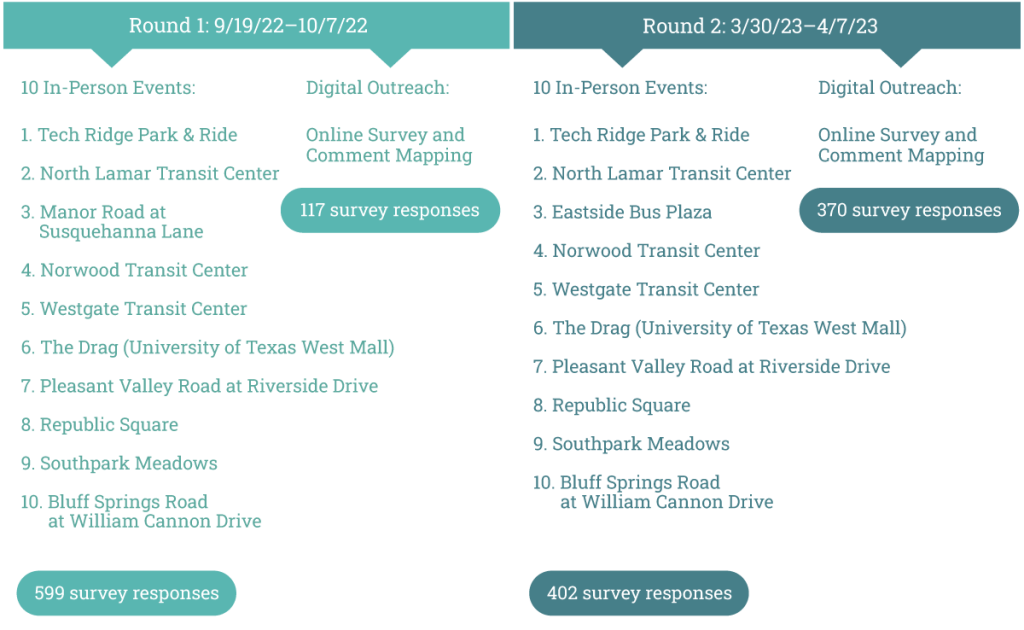
Two rounds of public engagement informed the recommendations of this report. Engagement was conducted by Transportation and Public Works staff, together with CapMetro, consultants, and language translators. Each round of engagement included 10 in-person events at transit stops across the city, as well as a digital outreach component promoted through newsletter posts, social media outlets, CapMetro MetroAlert text messages, and on-board bus signage. Participants filled out surveys and mapped feedback related to their transit-riding experience. An overview of the public engagement process, which resulted in more than 1,400 survey responses, is summarized in the following figure:
Project Map
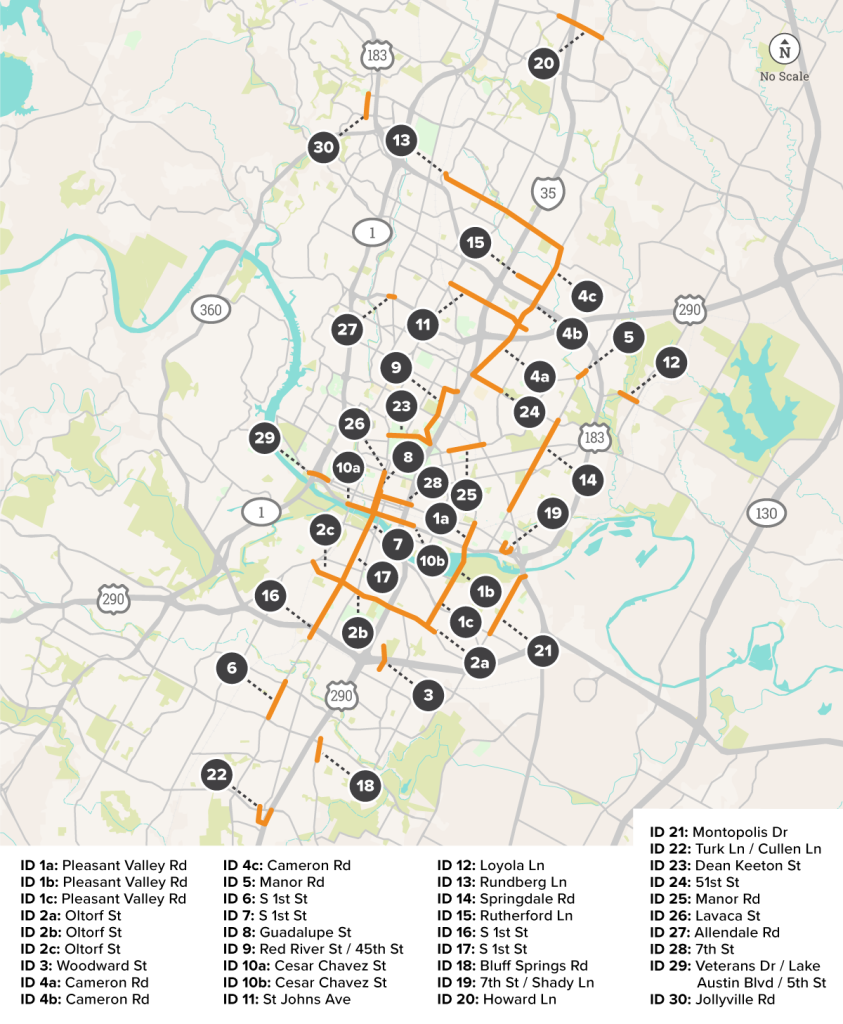
Feedback received during the public engagement process, together with data from the Bus Delay Analysis Tool, resulted in proposed transit infrastructure improvements at 37 locations across the city. These locations were identified as having high needs for transit speed, reliability, safety and access improvements. Please note that Project Identification (ID) numbers on the map below are not indicative of priority ranking and are meant for identification purposes only.
Project Locations
Project Recommendations
| Project ID |
Project Location |
Proposed Enhancements |
Project Cost |
Project Duration* |
|---|---|---|---|---|
| 1a |
Pleasant Valley Road between Webberville Road and Cesar Chavez Street |
Traffic signal Transit priority lane Bus stop improvements Intersection improvements |
$2.5M |
Long |
| 1b |
Pleasant Valley Road between Cesar Chavez Street and Lakeshore Boulevard |
Transit priority lane |
$8.5M |
Long |
| 1c |
Pleasant Valley Road between Lakeshore Boulevard and Oltorf Street |
Transit priority lane Bus queue jump signal Bike lane improvements Pedestrian crossing improvements Bus stop improvements |
$1.6M |
Medium |
| 2a |
Oltorf Street between Wickersham Lane and I-35 |
Access management improvements Pedestrian crossing improvements Bus stop improvements |
$0.5M |
Short |
| 2b |
Oltorf Street between I-35 and South First Street |
Pedestrian crossing improvements Bus stop improvements |
$1.4M |
Medium |
| 2c |
Oltorf Street between South First Street and South Lamar Boulevard |
Traffic signal Bus stop improvements Transit priority lane feasibility study |
$1.1M |
Medium |
| 3 |
Woodward Street between Parker Lane and Freidrich Lane |
Transit priority lane Bus queue jump signal Bus stop improvements |
$1.7M |
Long |
| 4a |
Cameron Road between 51st Street and US 290 |
Intersection improvements Pedestrian crossing improvements Bus stop improvements |
$1.9M |
Long |
| 4b |
Cameron Road between US 290 and US 183 |
Pedestrian crossing improvements Bus stop improvements Transit priority lane feasibility study |
$1.0M |
Medium |
| 4c |
Cameron Road between US 183 and Rundberg Lane |
Transit priority lane Bus queue jump signal Pedestrian crossing improvements Bus stop improvements |
$3.6M |
Medium |
| 5 |
Manor Road between Springdale Road and Loyola Lane |
Intersection improvements Bike lane improvements Bus stop improvements |
$0.9M |
Medium |
| 6 |
South First Street between William Cannon Drive and Stassney Lane |
Pedestrian crossing improvements Bus stop improvements |
$0.6M |
Short |
| 7 |
South First Street Bridge between Barton Springs Road and Cesar Chavez Street |
Transit priority lane Turn lane improvements Bike lane improvements Bus stop improvements |
$0.8M |
Short |
| 8 |
Guadalupe Street between Cesar Chavez Street and 15th Street |
Bus stop improvements |
$0.8M |
Medium |
| 9 |
Red River Street/45th Street between Dean Keeton Street and Airport Boulevard |
Turn lane improvements Pedestrian crossing improvements Bus stop improvements Transit priority lane feasibility study |
$1.5M |
Long |
| 10a |
Cesar Chavez Street between B.R. Reynolds Drive and I-35 |
Feasibility study of transit priority lanes, median treatments, and turn restrictions |
$1.5M |
Medium |
| 10b |
Cesar Chavez Street between I-35 and Waller Street |
Transit priority lane |
$2.9M |
Long |
| 11 |
St Johns Avenue between North Lamar Boulevard and Berkman Drive |
Pedestrian crossing improvements Bus stop improvements |
$0.8M |
Medium |
| 12 |
Loyola Lane between Crystalbrook Drive and Johnny Morris Road |
Pedestrian crossing improvements Bus stop improvements |
$1.2M |
Medium |
| 13 |
Rundberg Lane between Cameron Road and Metric Boulevard |
Bus queue jump signals Pedestrian crossing improvements Bus stop improvements |
$3.3M |
Medium |
| 14 |
Springdale Road between Airport Boulevard and 51st Street |
Fill sidewalk gap Pedestrian crossing improvements Bus stop improvements |
$2.2M |
Medium |
| 15 |
Rutherford Lane between Cameron Road and Brettonwoods Lane |
Intersection improvements Pedestrian crossing improvements Bus stop improvements |
$0.3M |
Short |
| 16 |
South First Street at Ben White Boulevard Interchange |
Bus stop improvements |
$25K |
Medium |
| 17 |
South First Street between Ben White Boulevard and Barton Springs Road |
Access management improvements Pedestrian crossing improvements Bus stop improvements |
$0.8M |
Medium |
| 18 |
Bluff Springs Road between William Cannon Drive and Blue Meadow Drive |
Pedestrian crossing improvements Bus stop improvements |
$0.8M |
Short |
| 19 |
Seventh Street + Shady Lane near Levander Loop |
Fill sidewalk gap |
$0.2M |
Short |
| 20 |
Howard Lane between Metric Boulevard and McAllen Pass |
Intersection improvements Turn lane improvements Pedestrian crossing improvements Bus stop improvements |
$1.0M |
Medium |
| 21 |
Montopolis Drive between Riverside Drive and US 183 |
Pedestrian crossing improvements Bus stop improvements Transit priority lane feasibility study |
$2.3M |
Medium |
| 22 |
Turk Lane and Cullen Lane (Southpark Meadows) |
Pedestrian crossing improvements Curb management improvements |
$0.2M |
Short |
| 23 |
Dean Keeton Street between Guadalupe Street and Red River Street |
Transit priority lane Bike lane improvements Bus stop improvements |
$3.8M |
Medium |
| 24 |
51st Street between Cameron Road and Berkman Drive |
Access management improvements |
$4K |
Short |
| 25 |
Manor Road between Cherrywood Road and Airport Boulevard |
Traffic signal Pedestrian crossing improvements Bus stop improvements |
$1.6M |
Medium |
| 26 |
Lavaca Street between Cesar Chavez Street and Eighth Street |
Transit priority lane reconfiguration Bus stop improvements |
$0.6M |
Short |
| 27 |
Allendale Road between White Rock Drive and Burnet Road |
Access management improvements Pedestrian crossing improvements Bus stop improvements |
$0.4M |
Short |
| 28 |
Seventh Street between Lavaca Street and I-35 |
Transit priority lane Bus stop improvements |
$0.2M |
Medium |
| 29 |
Lake Austin Boulevard at Veterans Drive |
Bus stop improvements |
$50K |
Short |
| 30 |
Jollyville Road between Braker Lane and Great Hills Trail |
Intersection improvements Pedestrian crossing improvements Bus stop improvements Transit priority lane feasibility study |
$0.7M |
Medium |
| Total Cost: |
$53M |
*Short: 0-2 years; Medium: 2-5 years; Long: 5+ years
Implementation & Next Steps
Funding
There are currently two main funding sources for implementation:
- 2020 Austin Mobility Bond funds
- CapMetro interlocal agreement funds
The $53M in proposed improvements exceeds the available funding from these two sources. To fully implement all projects, other funds may be sought from future mobility bonds, grant opportunities, and other regional, state or federal funding sources.
Project Development
The 37 projects recommended in this report are planning-level proposals to improve transit speed, reliability, safety and access through investment in transit supportive infrastructure. Moving these projects to implementation will require further analysis, design, and community engagement. Many projects will also require collaboration with other City departments and partner agencies, like CapMetro, the Texas Department of Transportation (TxDOT) and Austin Transit Partnership, to ensure proper coordination prior to implementation. In general, moving these projects to implementation will follow this process:
Schedule
The schedule for implementing each project will vary and may depend on a variety of factors including complexity of design, right-of-way availability, partner and community feedback, funding availability, and staff resources. Up to half of the recommended projects may be implemented in the short (0-2 years) and medium terms (3-5 years).
Transit Enhancement Toolbox
The Transit Enhancement Program works to improve mobility and access to opportunity by enhancing areas of the built environment to support transit riders and transit operations. This Transit Enhancement Toolbox is a collection of potential capital and operational treatments that can be applied in Austin to improve transit speed, reliability and access, and create safer, more predictable interactions between transit and other travel modes.
The Transit Enhancement Toolbox includes 32 tools across four categories ranging from low-cost, minor infrastructure improvements to high-dollar, major infrastructure improvements. The toolbox is intended to serve as a resource for both agency staff and the community, and not only identifies the tools available to improve transit operations, safety and access in Austin, but informs stakeholders about the benefits, trade-offs, and considerations required to implement these tools across the city.
Tools are grouped into four categories, based on the issue area each tool is meant to address:
- Streets and Intersections
- Stations and Stops
- Access and Multimodal Interactions
- Traffic Signals and Operations
The full Transit Enhancement Toolbox is provided in the appendix of this report. The proposed improvements recommended in this report were pulled from the Transit Enhancement Toolbox. Implementation of most of these tools requires coordination between TPW and its partners, including CapMetro, Austin Transit Partnership, and TxDOT.
Public Outreach & Stakeholder Engagement
Public outreach and stakeholder engagement was critical to the development of this report and directly informed project recommendations. Over 1,400 community members who rely on public transit and its infrastructure provided meaningful feedback on the kinds of improvements needed to enhance transit operations, access and safety in Austin. Those community members were engaged in-person and online during two rounds of public outreach, and engagement opportunities were promoted through newsletter posts, social media outlets, CapMetro MetroAlert text messages, and on-board bus signage.
CapMetro bus operators also provided their input on locations where transit infrastructure improvements are needed most during four operator outreach events held at CapMetro bus garages. Additionally, a Technical Advisory Group composed of City of Austin, CapMetro and Austin Transit Partnership staff provided guidance throughout the report development process and directly supported public outreach.
Public outreach summary documents, which detail the methods and findings of the engagement events, are included in the appendix of this report.
Operator Outreach
During Spring 2022, project staff conducted a total of four bus operator outreach events at both the North Ops CapMetro garage located off Burnet Road and the main garage located on East Fifth Street. The in-person interviews with CapMetro bus operators were conducted to gain insights about recurring operational issues directly from drivers. During conversations with dozens of bus operators, the project team noted 106 unique locations where operators identified the need for transit infrastructure improvements to address safety and operational issues such as difficult turning movements and sub-optimal traffic signal timing. The insights gained from these interviews were incorporated into the project development process.
In-Person Outreach
The project conducted two rounds of in-person outreach events at bus stops across the city. The first round occurred in Fall 2022 and the second in Spring 2023, and each consisted of tabling at 10 different transit stop locations. The stop locations were selected based on ridership data, demographic considerations, and to ensure an equitable distribution across Austin. Events consisted of paper surveys filled out by respondents in English and Spanish, with a Vietnamese translator present at select locations to support engagement. In addition, outreach events included maps showing the roadway and transit network. Participants were able to point to specific locations and provide feedback on their experiences using and accessing transit on the map.
Round 1 (September - October 2022): The first round of public outreach focused on understanding the community’s priorities for transit infrastructure improvements. Community members were asked to rate the importance of investments in:
- Making transit fast and reliable by adding infrastructure like bus lanes and signals for transit.
- Making transit easier to access by improving infrastructure like sidewalks and roadway crossings.
- Addressing equity by focusing transit investments in historically underserved communities.
Bus Operator Outreach Events
| Event |
Date |
Time |
Location |
|---|---|---|---|
| 1 |
May 24, 2022 |
7:00 am – 8:30 am |
CapMetro Main Garage |
| 2 |
May 24, 2022 |
12:30 pm – 2:00 pm |
CapMetro Main Garage |
| 3 |
June 2, 2022 |
7:00 am – 8:30 am |
North Ops CapMetro Garage |
| 4 |
June 2, 2022 |
12:30 pm – 2:00 pm |
North Ops CapMetro Garage |
The results of the survey indicated that an overwhelming majority of the respondents found it was “very important” to prioritize all three kinds of investments. The 599 surveys received during Round 1 of in-person outreach informed the weighting of potential project locations, resulting in a list of 30 locations that allow for investment in all three community priorities. The 131 mapped comments received during Round 1 were incorporated into the BDAT for reference during the project development process.
Community Priorities
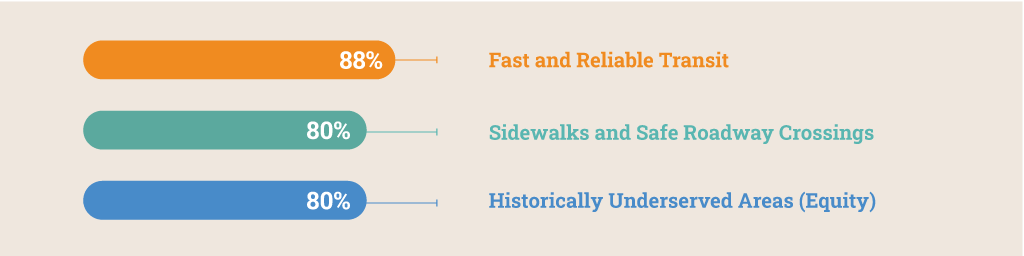
In total, 716 online and in-person surveys were filled out in Round 1. A strong majority of respondents rated each of the three primary questions as “Very important” or above, with 88% for the first question, 80% for the second, and 80% for the third. Surveys were filled out in both English and Spanish, with English being the majority at 607 (85%) and Spanish at 109 (15%).
Round 1 of In-Person Outreach
| Date |
Time |
Location |
|---|---|---|
| September 22, 2022 |
8:00 am – 11:00 am |
Tech Ridge Park & Ride |
| September 22, 2022 |
3:00 pm – 6:00 pm |
North Lamar Transit Center |
| September 27, 2022 |
11:00 am – 2:00 pm |
Manor Road at Susquehanna Lane |
| September 27, 2022 |
3:00 pm – 6:00 pm |
Norwood Transit Center |
| September 28, 2022 |
11:00 am – 2:00 pm |
Westgate Transit Center |
| September 28, 2022 |
3:00 pm – 6:00 pm |
The Drag (University of Texas West Mall) |
| September 29, 2022 |
11:00 am – 2:00 pm |
Pleasant Valley Road at Riverside Drive |
| September 29, 2022 |
3:00 pm – 6:00 pm |
Republic Square |
| October 4, 2022 |
11:00 am – 2:00 pm |
Southpark Meadows |
| October 4, 2022 |
3:00 am – 6:00 pm |
Bluff Springs Road at William Cannon Drive |
Round 2: (March - April 2023): The second round of in-person outreach focused on the trade-offs inherent to improving transit operations and access. The first trade-off question related to willingness to walk farther to a bus stop to allow for faster bus service and the second trade-off question related to prioritizing transit improvements when working with a limited budget. The results to the first question indicated that a slight majority of survey respondents prefer short walking distances to transit stops even if the bus travels at a lower speed due to the increased number of stops. The results to the second question showed that a larger majority of survey respondents prefer funding to be spread to many different lower cost projects across the city as opposed to funding being used for a small number of projects with high capital costs. The 402 surveys received during Round 2 of in-person outreach were used to shape project recommendations such as proposed bus stop additions, relocations, and consolidations. The survey results will also be a valuable resource moving forward to inform the prioritization of project implementation.
In-Person Outreach Demographics
Demographic information, including age, gender, cultural identity, disability status, and annual income, was collected during each round of in-person public outreach to ensure that the public that was engaged reflected the demographics of Austin and CapMetro riders. All demographic questions were presented as optional to survey participants. The demographic make-up of in-person survey respondents generally aligned with the demographics presented in CapMetro’s Origin and Destination Study, which was completed in 2015. For example, people in the lowest income bracket ($0 - $24,999) are over-represented among CapMetro’s ridership (43%) compared with Austin as a whole (14%). During Round 1 and Round 2 of the at-stop outreach, the proportions of respondents who identified as being in this income bracket were 47% and 62%, respectively. The survey results showed similar successes in reaching other underserved populations including people of color and those who identify as having a disability. However, it is important to note that younger transit riders, such as those below the age of 18, were underrepresented in both rounds of public outreach. The full breakdown of respondent demographics are presented in the public outreach summaries included in the appendix of this report.
Transit Trade-offs
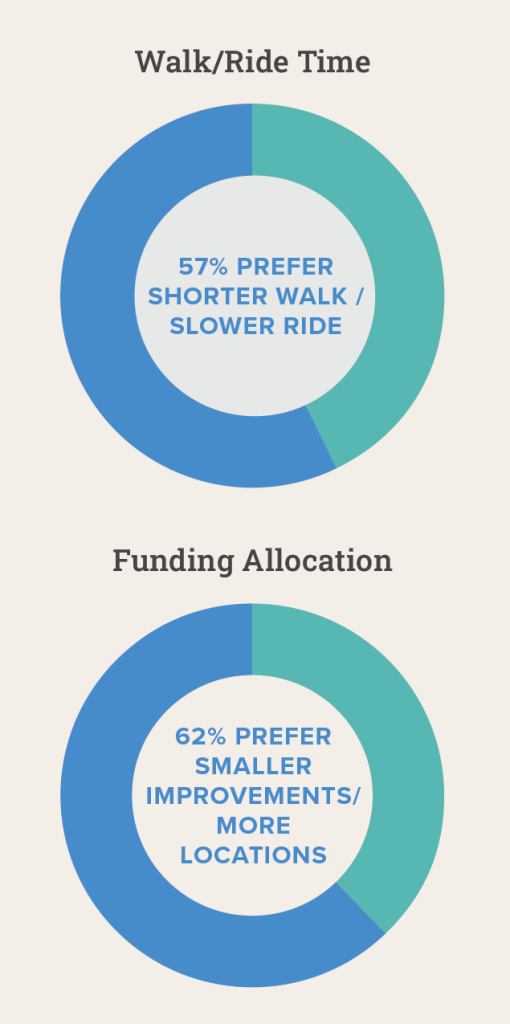
In total, 772 online and in-person surveys were filled out. A small majority of respondents would rather have a slower ride but a shorter walk to the bus stop.
A larger majority of respondents would like to see smaller improvements in more locations.
Round 2 of In-Person Outreach
| Date |
Time |
Location |
|---|---|---|
| March 21, 2023 |
7:00 am – 10:00 am |
Tech Ridge Park & Ride |
| March 21, 2023 |
3:00 pm – 6:00 pm |
North Lamar Transit Center |
| March 23, 2023 |
11:00 am – 2:00 pm |
Eastside Bus Plaza |
| March 23, 2023 |
3:00 pm – 6:00 pm |
Norwood Transit Center |
| March 28, 2023 |
11:00 am – 2:00 pm |
Westgate Transit Center |
| March 28, 2023 |
3:00 pm – 6:00 pm |
The Drag (UT West Mall) |
| April 4, 2023 |
11:00 am – 2:00 pm |
Southpark Meadows |
| April 4, 2023 |
3:00 pm – 6:00 pm |
Bluff Springs Road at William Cannon Drive |
| April 5, 2023 |
11:00 am – 2:00 pm |
Pleasant Valley Road at Riverside Drive |
| April 5, 2023 |
3:00 pm – 6:00 pm |
Republic Square |
Online Outreach
In conjunction with the in-person engagement events, an online public outreach campaign was deployed through the use of a project website and promoted through social media, online newsletters, targeted advertising campaigns, stakeholder emails, CapMetroAlert text messages, and on-board bus signage. The project website included an identical survey to the ones conducted during each round of in-person engagement. In addition, interactive mapping tools were used so that respondents could geolocate specific locations where they had comments regarding their transit-riding experiences. All online surveys and mapping tools were available to respondents in both English and Spanish. In total, 117 online surveys were filled out during the first round of digital engagement and 370 online surveys were filled out during the second round.
Online Outreach Demographics
Demographic information related to age, gender, cultural identity, disability status, and annual income was collected during each round of online engagement to ensure that the public that was engaged reflected the demographics of Austin and CapMetro riders. It was found that respondents to both rounds of online surveys were more likely to have a White racial background and have a higher annual income compared with demographic make-up of CapMetro’s riders overall as presented in the 2015 Origin and Destination survey.
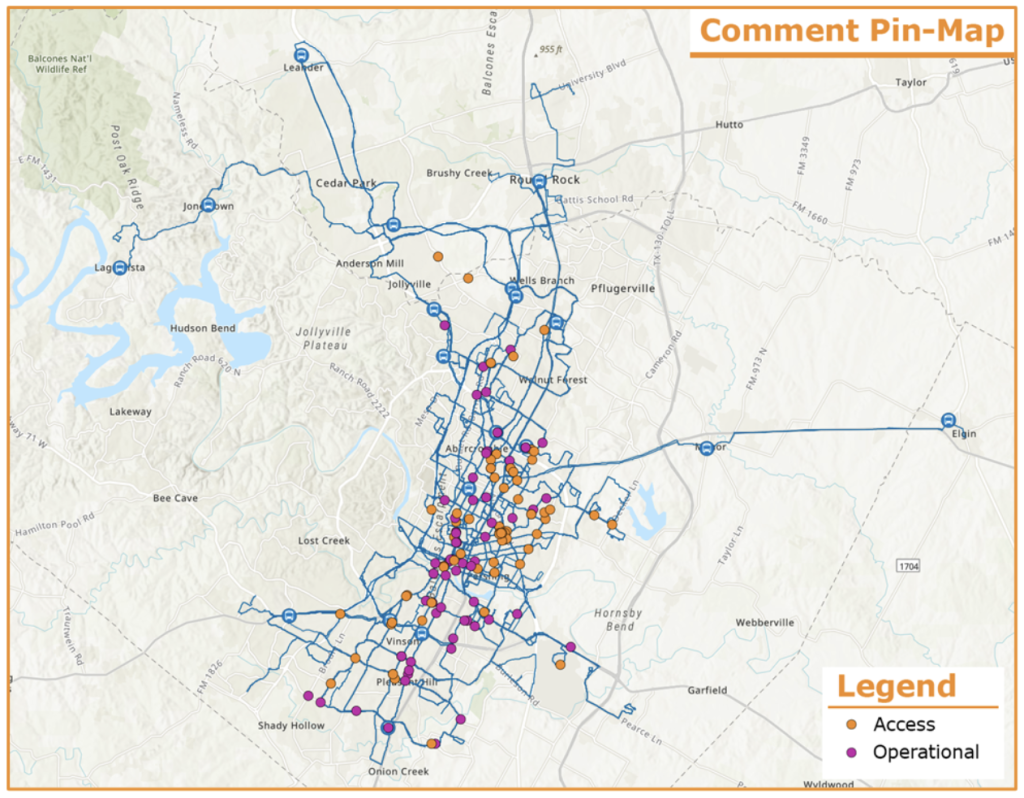
Mapped comments from the first round of online public outreach
Technical Advisory Group Engagement
Early in the process of developing this study, a Technical Advisory Group (TAG) comprised of City of Austin, CapMetro, and Austin Transit Partnership staff was formed. The TAG included representatives with expertise in accessibility, bicycle and pedestrian facilities, environmental policy, public engagement, signal operations, transportation facility design, transportation safety, transit and transportation planning, and transit operations. This group met 10 times over the course of the project to provide guidance on a variety of relevant technical issues. The feedback provided by the group helped guide and shape the direction of the study from Transit Enhancement Toolbox development and existing conditions analysis through final project recommendations.
Technical Advisory Group Meetings
| Date |
Meeting Topics |
|---|---|
| January 25, 2022 |
Study scope and schedule |
| March 4, 2022 |
Existing conditions methods and assumptions |
| March 23, 2022 |
Transit Enhancement Toolbox, public outreach plan |
| May 17, 2022 |
BDAT overview, site selection process |
| July 15, 2022 |
Site selection process, bus operator interview summary, Phase 1 public outreach methodology |
| November 4, 2022 |
Phase 1 public outreach results, site selection process, project development |
| December 2, 2022 |
Project development |
| January 26, 2023 |
Phase 2 public outreach methodology, project development |
| April 21, 2023 |
Phase 2 public outreach results, project development and prioritization, performance monitoring |
| July 14, 2023 |
Final report |
Key Findings
The public found it “very important” to prioritize investments in improving transit speed and reliability, making transit easier and safer to access, and investing in historically underserved areas when making transit infrastructure improvements.
A slight majority of survey respondents prefer shorter walking distances to transit stops even if the bus travels at a lower speed due to the increased number of stops.
A larger majority of survey respondents prefer funding to be spread across many different project locations throughout the city rather than investing in a small number of transit enhancement projects with high capital costs.
Project Identification
Existing Conditions Overview
The 37 transit enhancement projects recommended in this report were identified as a result of a deliberative, step-by-step process. One of the first steps in that project identification process was the development of a web-based dashboard that visualizes how well the existing transit network is performing. This dashboard is referred to as the Bus Delay Analysis Tool (BDAT) and compiles a variety of data related to transit operations, safety and access including bus operating speeds and passenger ridership, roadway infrastructure and community demographics. The capabilities of the BDAT include:
Identifying where buses are experiencing delays at the route or corridor level.
Allowing the user to filter bus delay data in many ways, such as by route or segment, by time of day, or by direction.
Producing maps, charts, and other visualizations of bus delay data.
Overlaying delay data with access, safety and demographic information, among other contextual data.
Making transit data available for download in standard Excel and GIS formats for analysis outside the BDAT.
For this study, the project team imported data from CapMetro’s Fall 2021 service period, which ran from September 19, 2021, through December 19, 2021. As more recent data becomes available, additional service periods will be imported into the BDAT. This capability is critical for monitoring the performance of projects after they are implemented and identifying changing needs.
Evaluating Transit Performance
Next, the existing transit network was divided into more than 300 segments in the BDAT. A segment is defined as a continuous link in the roadway network used by transit. Segments are bi-directional and vary in length, and cut-off
points between segments were determined using characteristics such as major intersections and changes in roadway type (e.g., highway, local street).
The performance of each segment was then measured in the BDAT based on three categories of analysis — transit speed and reliability, transit access and safety, and equity. The underlying metrics used for this analysis are described below:
Transit Speed & Reliability Metrics
- Segment Delay per Mile: This represents the transit delay normalized by segment length.
- Passenger Delay per Mile: This represents the total delay experienced by passengers, normalized by segment length.
- Travel Time Reliability Ratio: This compares travel time variability at a given time of day relative to a minimum travel time variability.
- Ratio of Auto Speed to Transit Speed: This represents the comparison of average auto speed to transit speed on the segment.
Transit Access and Safety Metrics
- Missing feet of sidewalk per mile:
This measures the proportion of the roadway segment without sidewalks. - Crosswalk spacing: This measures the number of marked crosswalks along segments as a proxy for crosswalk spacing.
- Crashes per mile: This measures the number of crashes per mile for the most recent five years of available data. Separate metrics were developed for total crashes, bicycle crashes, and pedestrian crashes.
- Number of stops per mile: This measures the average distance between stops on a segment and is a proxy for the distance traveled to access transit service.
- POSTED speed limit: This represents the posted speed limit for the segment.
Equity Metrics
- Equity Index: This provides a framework for analyzing equity in transportation project development, and is associated with the City’s Equity Analysis Zones. The zones (based on census tracts) are scored from 1-100, from low to high concentration of vulnerable populations. For more information on Equity Analysis Zones, refer to the Equity Analysis Zone Report.
- Percent Daily Load on Minority Routes: This represents ridership on routes that are identified as serving a substantial market of minority populations as determined through a Title VI equity analysis.
Using the BDAT, scores for each metric were then calculated and assigned to all 300+ segments to understand each segment’s performance.
Map of Ranked Segments in the BDAT Analysis
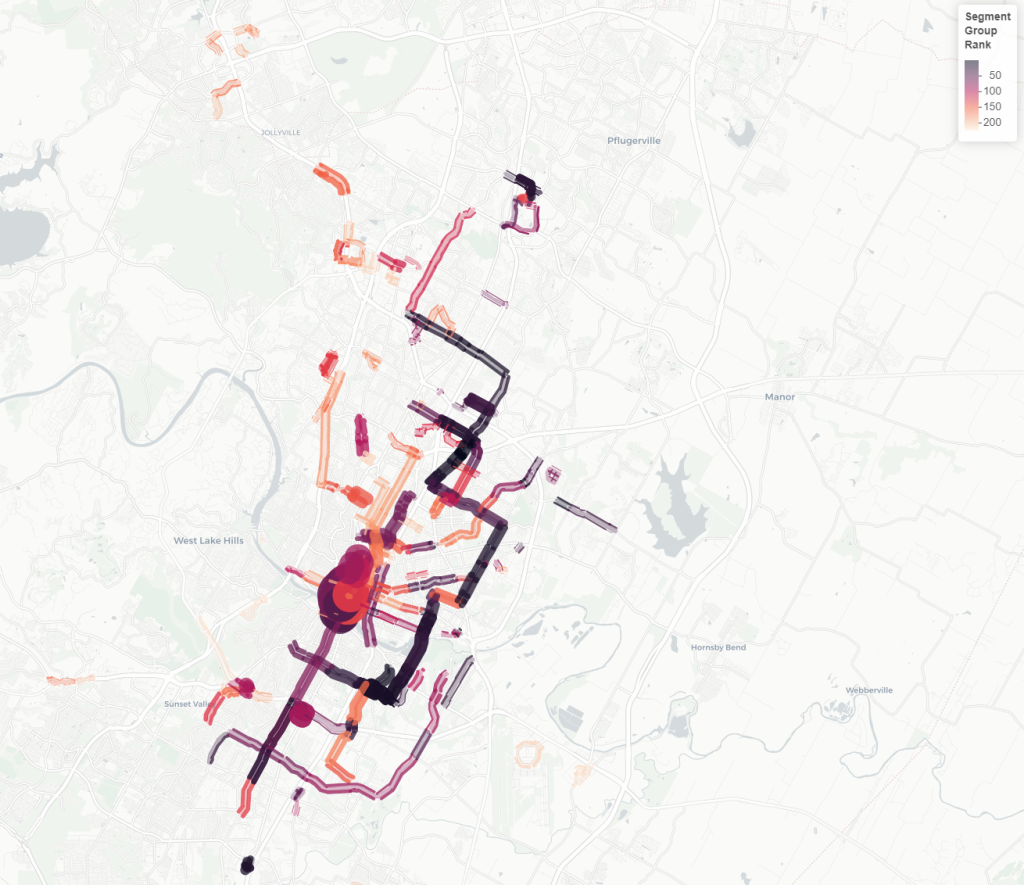
Darker-colored segments represent roadways with a higher need for transit infrastructure investment and lighter-colored segments represent roadways with a lower need for transit infrastructure investments.
Prioritizing Project Locations
When working with limited funding, the City has to prioritize projects. To develop a prioritized list of project locations from the more than 300 segments in the BDAT, the scores for each segment were weighted based on the community priorities expressed during the first round of public outreach conducted in Fall 2022. The results of the Round 1 survey indicated that an overwhelming majority of survey respondents found it was “very important” to prioritize investments equally in transit speed and reliability, transit access and safety, and historically underserved areas (equity). As a result, the metrics under the three categories of analysis described above were weighted equally so that the total number of points that a segment could earn was the same for each category of analysis.
Additionally, separate calculations were performed for each Equity Metric to ensure an equal balance of projects in locations where a high density of minority populations reside and in locations where transit ridership among minority populations is high.
Lastly, segments that overlap with Project Connect Light Rail Transit corridors and 2016 Mobility Bond corridors were excluded from the list. This was done so report recommendations could focus on roadway segments that are served by local transit service and are lacking existing corridor plans and future light rail investment as directed by Austin City Council in the development of the 2020 Mobility Bond.
In total, 30 project locations were identified using this prioritization methodology. However, locations along Pleasant Valley Road, Oltorf Street, Cameron Road, and Cesar Chavez Street were later subdivided into separate projects due to their complexity and length. Therefore, the final number of project locations prioritized for investment is 37.
Developing Project Recommendations
Once the top 37 project locations were identified, recommended transit infrastructure improvements were developed for each location. The proposed improvements were developed based on information in the Transit Enhancement Toolbox discussed in an earlier section of this report.
The project team also referenced a variety of data when recommending improvements, including:
- Bus and passenger delay
- Transit travel time reliability
- Stop activity (boardings and alightings)
- Mapped comments from bus operator engagement and public outreach
- Traffic signal locations
- Pedestrian crossing gaps
- Existing and planned bicycle facilities
- Location of community resources (such as schools, health facilities, and supermarkets)
- Existing bus stop locations
In addition, aerial imagery, traffic counts and local knowledge of traffic patterns, project examples from outside the Austin area, and feedback from the Technical Advisory Group all informed the recommendations at each project location. At a total of 11 signalized intersections with a high amount of complexity, a capacity analysis was performed using Synchro traffic modeling software to evaluate project feasibility.
Examples of transit infrastructure improvements recommended at project locations include but are not limited to transit signal priority, pedestrian crossing improvements, bus stop modifications, and transit priority lanes. The recommended improvements are expected to have the highest impact on transit speed, reliability, access and safety at each of the 37 project locations. The next section of the report provides project overviews for each identified project location including a description of proposed improvements, benefits and issues addressed, and implementation details.
Project Recommendations
The data-driven process outlined in the previous section of this report resulted in the 37 project recommendations described on the following pages. These projects represent planning-level proposals to enhance transit infrastructure through investment in:
- Transit speed and reliability
- Transit access and safety
- Historically underserved areas (equity)
The level of needed investment in these three categories varies by project location, with scores ranging from low (☑️) to high (☑️☑️☑️).
The proposed infrastructure improvements at each project location include many of the treatments described in the Transit Enhancement Toolbox found in the appendix of this report. All project recommendations will require additional analysis, design and community engagement prior to implementation. Additionally, all projects will require coordination with other City stakeholders and partner agencies, including CapMetro, Austin Transit Partnership, and the Texas Department of Transportation, as appropriate. This coordination will ensure that a broad spectrum of mobility needs are considered at each location prior to implementation.
Project Fact Sheets
- 51st Street
- Allandale Road
- Bluff Springs Road
- Cameron Road
- Cesar Chavez Street
- Dean Keeton Street
- Guadalupe Street
- Howard Lane
- Jollyville Road
- Lake Austin Boulevard
- Lavaca Street
- Loyola Lane
- Manor Road (Springdale Road to Loyola Lane)
- Manor Road (Cherrywood Road and Airport Boulevard)
- Montopolis Drive
- Oltorf Street
- Pleasant Valley Road
- Red River Street
- Rundberg Lane
- Rutherford Lane
- Seventh Street
- Shady Lane
- South First Street (William Cannon Drive and Stassney Lane)
- South First Street (at Ben White Boulevard)
- Springdale Road
- St Johns Avenue
- Turk Lane and Cullen Lane
- Woodward Street
Implementation & Next Steps
Funding
There are two existing funding sources available for the implementation of projects recommended by this report:
2020 Austin Mobility Bond funds: Up to $19 million in voter-approved general obligation bonds may be applied to Transit Enhancement projects that address reliability, speed, and safety of local bus service and improve transit access. Projects using bond funds should be completed by 2028.
CapMetro Transit ILA funds: Up to $1 million in funds are available each fiscal year through an interlocal agreement with the City of Austin. CapMetro concurrence is required before applying funds towards projects recommended by this report.
The full implementation of all projects recommended in this report is expected to total approximately $53 million in 2023 dollars. As a result, additional funding will be needed. It is acknowledged that longer-term and larger-scale capital improvement projects such as street reconstruction and fully-dedicated transit facilities will require additional funding. Potential funding sources include:
- Future City bond elections
- Development mitigation funds
- Capital Area Metropolitan Planning Organization (CAMPO) funding opportunities: Agencies within the CAMPO boundaries compete for funding based on evaluation criteria identified for each call for projects. Funding cycles vary.
- Texas Department of Transportation (TxDOT) Transportation Alternatives Set-Aside (TA) Program: TxDOT administers Federal Transit Administration (FTA) grants through statewide calls for projects, typically in two-year cycles.
- Federal Infrastructure Investment and Jobs Act (IIJA) funds: These funds are available through competitive grant applications for fiscal years 2022 through 2026. Applicable programs may include:
- Safe Streets for All (SS4A)
- Multimodal Project Discretionary Grant Opportunity (MPDG)
- Rebuilding American Infrastructure with Sustainability and Equity (RAISE)
Project Development
The projects in this report represent planning level recommendations to improve the speed and reliability of transit service in Austin, and make that service easier and safer to access. The next steps in moving these projects toward construction will vary by location and may include more detailed design, traffic analysis, and/or additional community engagement. While the level of design and analysis varies by project, public outreach will be conducted prior to the implementation of each project and project performance will be monitored to assess the effectiveness of each project following implementation.
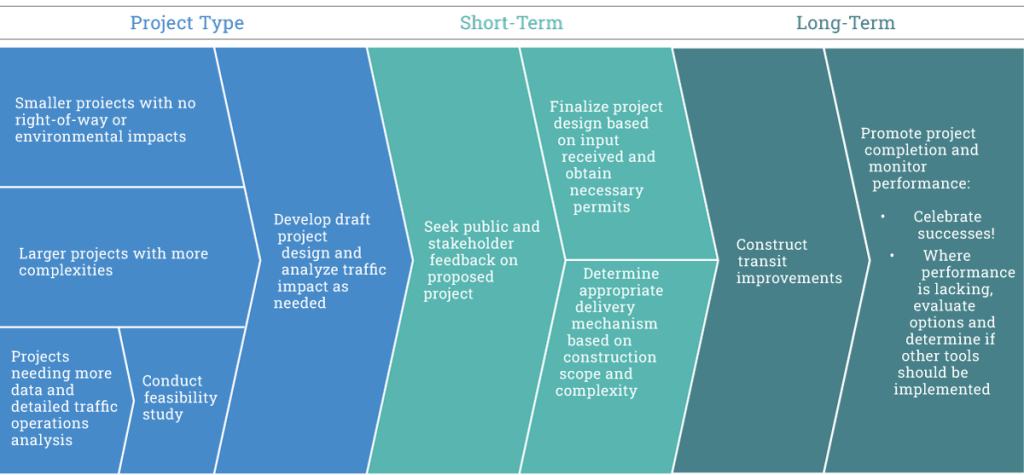
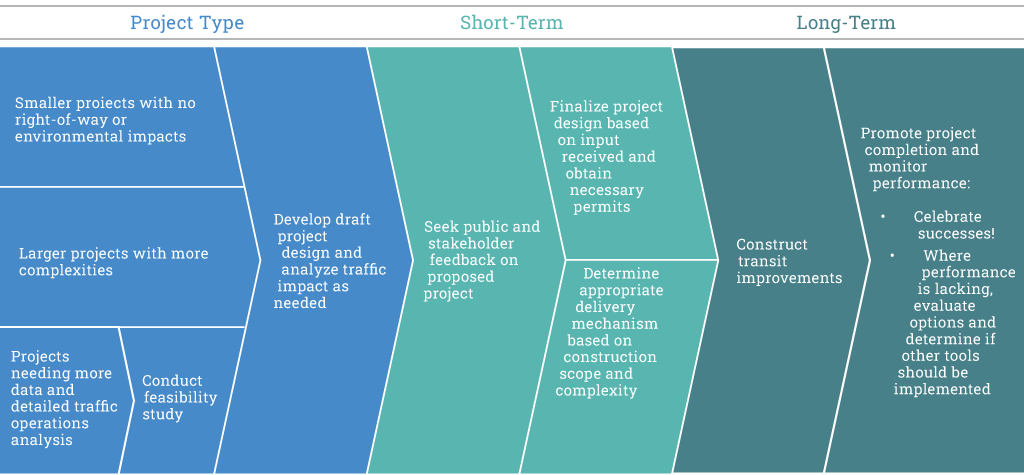
Project Type and Next Steps
Schedule
Each project included in this report has an approximate duration from conceptual design through construction, generally ranging from:
- 6 to 24 months for feasibility studies
- 3 to 24 months for smaller, less complex projects implemented through field engineering
- 3+ years for larger, more complex projects implemented through design-bid-build
Some projects may be integrated into other planned projects in the City’s Capital Improvement Program. Implementation of other projects may need to be considered in light of Project Connect efforts, particularly where light rail transit alignments are still being evaluated and finalized, and those alignments overlap with recommended transit enhancement projects.