
Adopted November 30, 2023
Download the City of Austin Sidewalks, Crossings, and Shared Streets Plan (Adopted Nov. 30, 2023) and the appendices.
Contents
- Executive Summary
- Introduction
- Sidewalks and Shared Streets
- Pedestrian Crossings
- Implementing the Plan
- Appendices
- ATX Walk Bike Roll Process Summary Appendix
- Sidewalk Plan History Appendix
- ATX Walk Bike Roll Crash Analysis Appendix
- Network Scenarios Appendix
- Sidewalk and Shared Street Network Plan Map Appendix
- Sidewalk and Shared Street Project Prioritization Methodology Appendix
- Sidewalk and Shared Street Conditions and Priorities (Maps and Tables) Appendix
- Shared Streets Manual Appendix
- Crossing Gap Identification and Prioritization Methodology Appendix
- Crossing Gap Maps
Executive Summary
Austin is a one-of-a-kind place that blends bold ideas and innovation with diverse flavors, culture, and character. True to form, the City has set an ambitious goal: 50 percent of all the trips made in Austin by 2039 will be made by walking, biking, transit, or other eco-friendly ways of getting around. This 2023 Sidewalks, Crossings, and Shared Streets Plan plays an important part of achieving that goal. It focuses on strategies to manage and improve sidewalks, shared streets, and pedestrian crossings within City of Austin right-of-way. The Plan was developed alongside similar plans focused on urban trails and bikeways. All three efforts were deeply rooted in a shared public outreach process called ATX Walk Bike Roll (ATXWBR) and build upon the vision from the Austin Strategic Mobility Plan (ASMP) and the Imagine Austin Comprehensive Plan.
Purpose of the Plan
Encourage walking as a viable mode of transportation, improve pedestrian safety, and enable people to walk to and from transit stops.
Existing and Planned Pedestrian Network
As of October 2022, there are approximately 4,800 miles of street frontage in Austin. The existing pedestrian network includes 2,800 miles of frontage1 with sidewalk and well over 8,000 improved crossings. This Plan identifies a need for an additional 810 miles of sidewalks, 370 miles of shared streets (accounting for 740 miles of frontage), and addressing 2,000 pedestrian crossing gaps.
1 A street frontage includes one side of a street for one block. Street frontages exist on both sides of every street.
What we heard
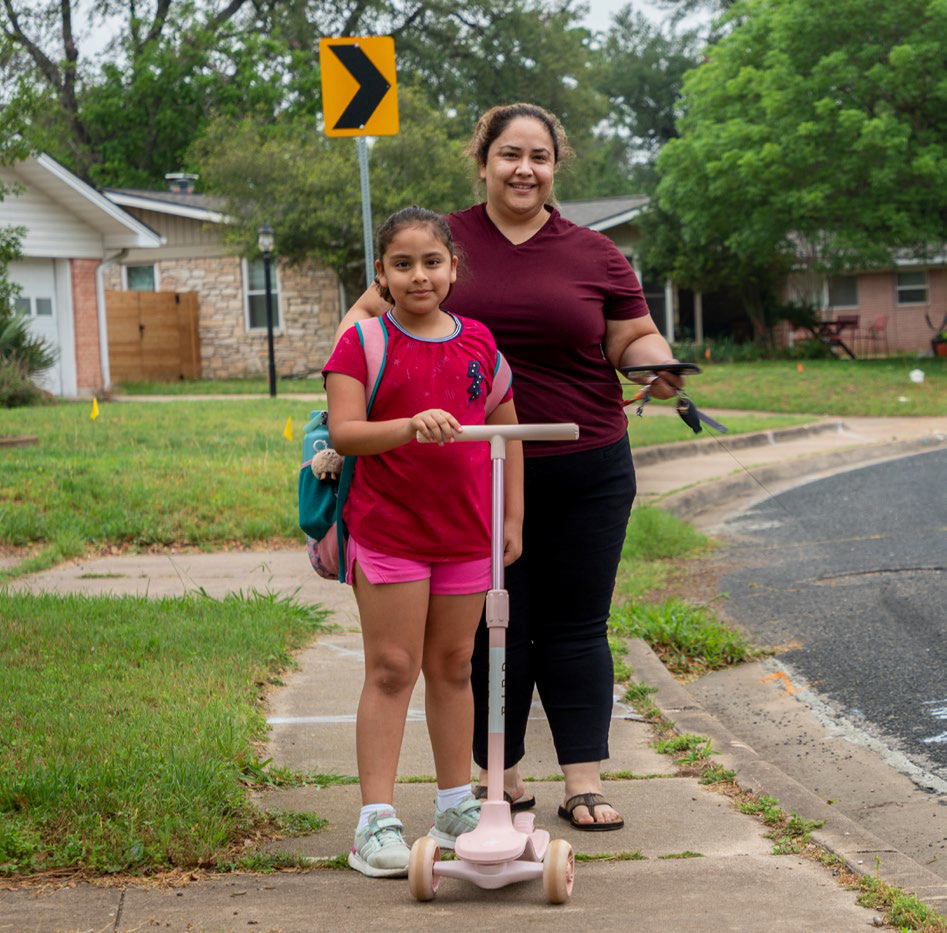
69% of all survey respondents and 72% of respondents from focus populations said they would like to walk more, but there are issues holding them back.
One resident put it this way:
"I’ve always used the bus to go to work. When going to nearby places, I would like to walk more (it has helped me reduce my blood pressure), but safety and security need to be improved for this." — Community member comment, October 2021
Key Strategies
This Sidewalks, Crossings, and Shared Streets Plan contains strategies and action items for implementation (see Chapter 4). Key strategies include the following:
- Prioritize equity in the completion and maintenance of the pedestrian network by 1) allocating more resources in areas of historical inequity and ongoing vulnerability; and 2) providing stable and sufficient funding through the Transportation User Fee and/or other non-bond sources for sustainable repair and rehabilitation.
- Provide safe, comfortable, and accessible pedestrian passage along and across every public street.
- Collaborate with public and private partners using a Complete Streets approach to improving the pedestrian network.
Key Targets and Indicators
- COMPLETE 100% of missing Very High and High-Priority sidewalks and shared streets by 2033
- ELIMINATE 50% of Very High and High-Priority crossing gaps within Focus Equity Analysis Zones (EAZ)2, along the Pedestrian High Injury Network (HIN), and/or within 1/4 mile of all identified schools, public transit stops and stations, and parks by 2033
- ACHIEVE & MAINTAIN 80% functionality for Very High and High-priority sidewalks by 2033 and 50% functionality for the sidewalk system by 2033
2 Equity Analysis Zones (EAZ) are based on Census data that describes an area’s social and economic vulnerability. The EAZs are classified into five categories, from Least Vulnerable to Most Vulnerable. Most Vulnerable and Medium-High Vulnerable EAZs, called Focus EAZs.
Introduction
The 2023 Sidewalks, Crossings, and Shared Streets Plan builds on over 20 years of pedestrian and sidewalk focused planning efforts (see Appendix B). The 2023 Plan incorporates many of the elements of the 2009 and 2016 sidewalk plans, including the data-driven and equity focused prioritization process. The 2023 Plan includes new measures to assess the completeness of the sidewalk network and contains a citywide assessment of pedestrian crossings. The 2023 Plan also expands on the previous plans with new analyses, strategies, and action items related to:
- Pedestrian Network Coverage and Access – New analytical tools provide answers to the questions: What percentage of parcels/properties in the city are connected to the existing sidewalk network? What percentage of key destinations can be reached by the existing sidewalk network? How does sidewalk coverage and access to different destinations vary across different neighborhoods?
- Shared Streets – As an alternative to sidewalks on low-traffic residential streets, Shared Streets use design changes and other methods to improve the pedestrian experience and help expand the pedestrian network. Shared streets cost less than sidewalks, which can mean faster expansion of the network
- Pedestrian Crossings – The 2023 Plan includes the first citywide, data-driven survey of pedestrian crossings. The analysis provides answers to the questions: Which crossings create safe and comfortable experiences for people walking across the street in different settings and contexts? In what locations does the distance between comfortable marked crossings exceed City standards? The focus is on non-signalized crossings.
- Affordability and Transportation – After performing an Equity Scan and developing a community-driven Equity Framework (see Appendices A1 and A2), the City recognized the need to more deeply engage with and learn from Austin’s communities of color and lower income communities. People from these communities were recruited to serve as Community Ambassadors to help shape this Plan. A key outcome was the articulation of Austin’s affordability crisis and ongoing displacement, which led to the identification of mobility-related strategies to improve affordability for vulnerable populations. The 2023 Plan was developed as part of a larger effort called ATX Walk Bike Roll. This public engagement for the 2023 Plan was coordinated as part of this larger effort and provided vital public input and feedback for the development of the 2023 Plan.
1.1. ATX Walk Bike Roll
ATX Walk Bike Roll was a coordinated effort by the City of Austin Transportation and Public Works Department to update Austin’s Sidewalks, Urban Trails, and Bicycle Plans. These plans guide how urban trails, sidewalks, pedestrian crossings, and bikeways are built and where they are needed most.
The guiding values of the ATX Walk Bike Roll process are shown in the text box to the right. In particular, ATX Walk Bike Roll centered racial equity throughout the plan update process. Racial equity can be defined as "the condition when race no longer predicts a person’s quality of life outcomes in our community." The ATX Walk Bike Roll Equity Scan is in Appendix A1 and the Equity Framework is in Appendix A2.
ATX Walk Bike Roll Values ATX Walk Bike Roll is about more than just getting from place to place. Here are a few examples:
- Communities – Urban trails, sidewalks, and bikeways are an important part of our local transportation system. Access to different travel options influences how communities grow, where we choose to live, and how we interact.
- Equity and Diversity – Austin’s transportation options need to serve everyone. Your life experience, race/ethnicity, cultural background, or ability should not make it harder for you to get around.
- Mobility and Accessibility – Walking, biking, and rolling are safe, affordable, and don’t require a license. Because sidewalks, urban trails, and bikeways are available to a broad range of ages and abilities, they help create more opportunities for people to participate in their community.
- Health and Environment – Our transportation system impacts our physical, social, mental, and environmental health. People will walk, bike, or roll more often when they have safe and easy routes to take. This can help cut down on car traffic and its negative environmental impacts.
- Connections – Urban trails, sidewalks, and bikeways connect communities to businesses, parks, and neighborhoods.
- Transportation and Housing Affordability – As Austin grows, so do housing costs and the cost of transportation. ATX Walk Bike Roll can help by providing a low-cost way to travel through a network of sidewalks, bikeways, and urban trails with easy access to transit throughout the city
1.1.1. Applying an Equity Framework
ATX Walk, Bike, Roll used an Equity Framework to center equity at each stage of the planning and decision-making process (see Appendix A2). A concerted effort was made during ATX Walk Bike Roll to ensure that participation in community engagement, "exceeds the racial/ethnic and income demographic makeup of the city and reflects the voices of those most negatively impacted by the process."
This effort came short of meeting this goal; however, when reviewing public input results, comments received from the focus population were compared to total responses to review differences and elevate input received from the focus population. In addition to general online engagement, targeted engagement strategies, such as paid Community Ambassadors and Spanish-language focus groups, were used to reach the focus populations for this effort: Black, Hispanic/Latinx, and other People of Color, and those earning less than 80% of the median household income.
What we heard
"Ethnic, low-income and minority segments of town are vastly undeveloped and underserved by Austin’s historic transportation plans leaving them without the necessary transportation infrastructure needed to thrive in their communities." — Community member comment, October 2021
Engaging with communities and individuals throughout ATX Walk Bike Roll was crucial, especially to understand community priorities and to seek public direction on key policy and investment decisions. Public input, guided by the Equity Framework, steered the planning process at strategic points throughout ATX Walk Bike Roll. Because the scale of this project spanned several planning areas— urban trails, sidewalk improvements, shared streets, and bikeways—there were multiple phases of community engagement. In each phase, the team focused on tailored questions to receive constructive feedback from the public to shape the updated plans.
These orange color text boxes throughout this document highlight what we heard through community engagement and how the feedback received is incorporated into the planned pedestrian network and implementation strategies.
The ATX Walk Bike Roll process prioritized engaging with People of Color, people with disabilities, and people with low incomes. In several locations throughout this document, we refer to "focus populations" as shorthand to refer to this group.
More information on the planning process, the Equity Framework, and outcomes of community engagement during the ATX Walk Bike Roll process can be found in Appendix A.
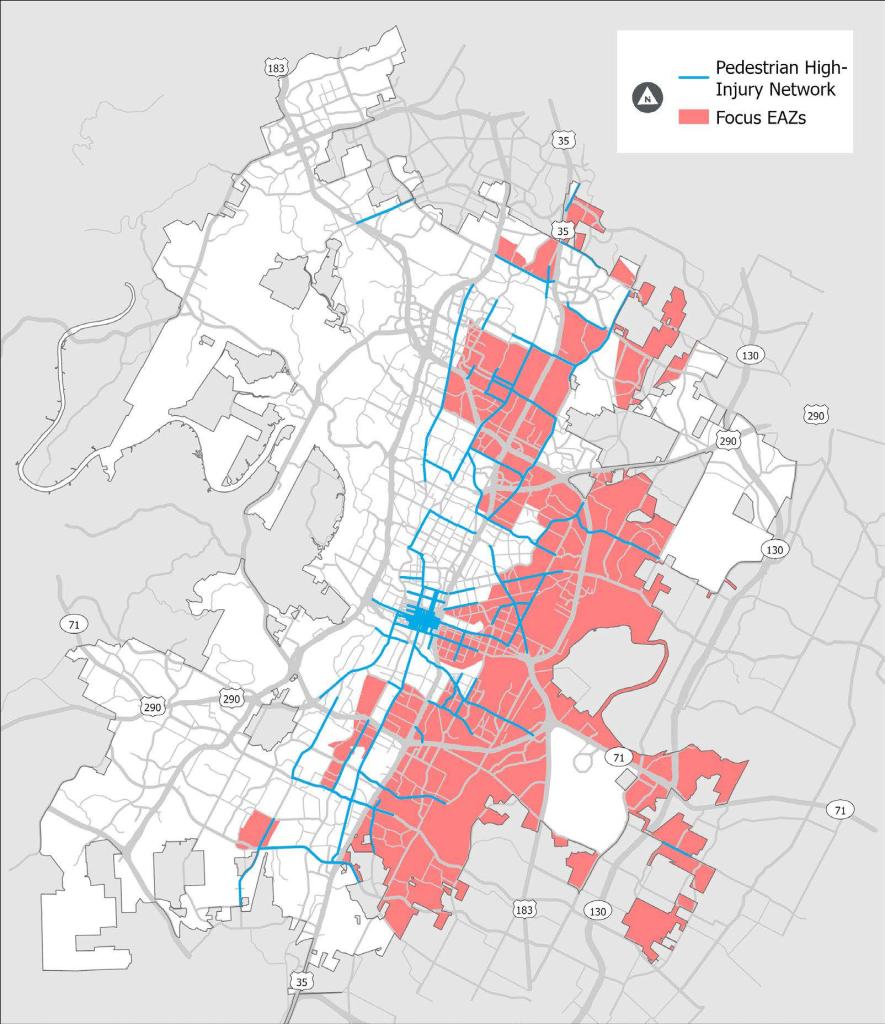
Figure 1-1. Map of Focus (Most Vulnerable and Medium-High Vulnerable) Equity Analysis Zones
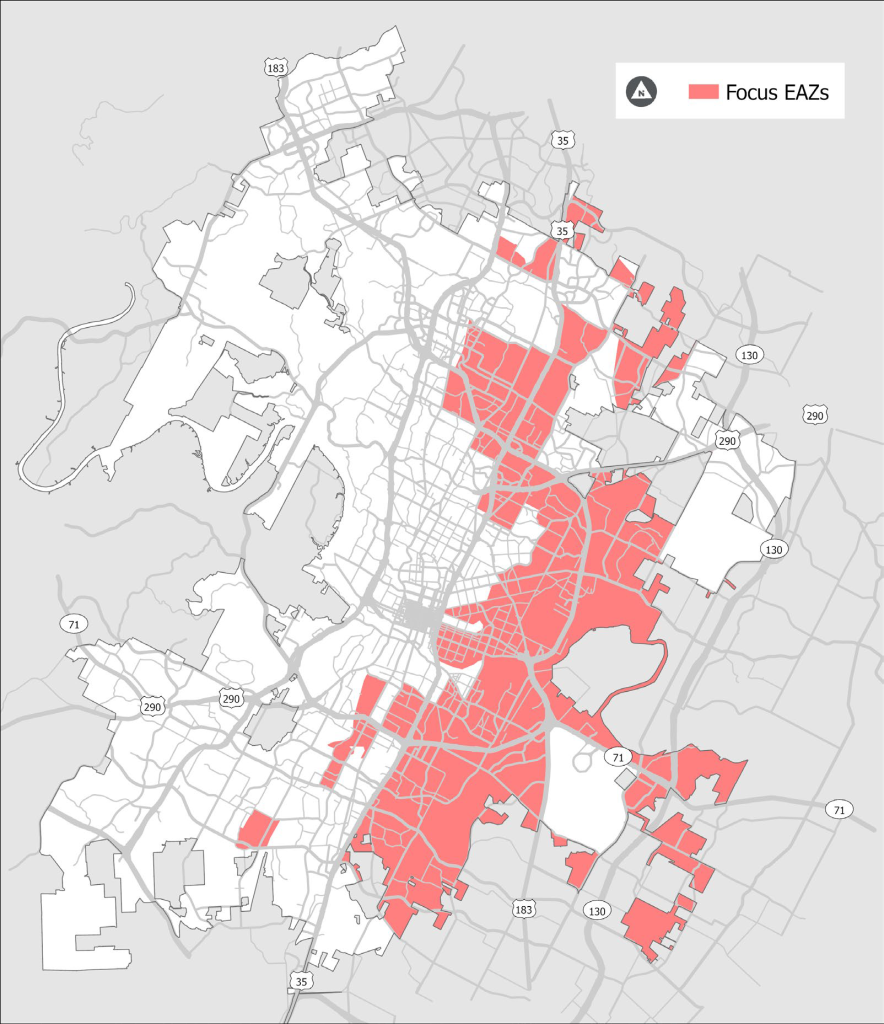
To provide consistency in measuring equitable outcomes across the plans and other City initiatives, the City—in collaboration with members of the community—developed Equity Analysis Zones to understand which areas of Austin have higher concentrations of historically marginalized populations. Equity Analysis Zones (EAZ) are based on Census tracts and include nine different US Census American Community Survey (ACS) variables that reflect an area’s social and economic vulnerability. The EAZs are classified into five categories, from Least Vulnerable to Most Vulnerable.
Figure 1-1 shows the majority of the Most Vulnerable and Medium-High Vulnerable EAZs, called Focus EAZs, are located on the east side of Austin. Many of these areas were once “redlined”, a historic practice of institutionalized discrimination by the government, banks, and other institutions based on the racial/ethnic or economic make-up of the community. Many of these areas are now experiencing high rates of displacement. More information on EAZs and historic inequities in planning and development in Austin can be found in the ATX Walk Bike Roll Equity Framework (see Appendix A2).
Equity Analysis Zones are used across Austin’s transportation programs as a tool to evaluate the equity of investments. Project selection will follow more detailed prioritization models.
The ATX Walk Bike Roll Equity Framework was applied to this Plan by engaging with, evaluating impacts for, and prioritizing needs of People of Color and people with low incomes, who have historically been underserved or harmed by planning and infrastructure decisions.
In this 2023 Sidewalks, Crossings, and Shared Streets Plan, the EAZ framework is used to analyze and identify potential disparities in the existing and planned pedestrian networks.
Specifically, comparisons are made between Focus EAZs and the rest of the city to identify disparities. As this Plan, the Urban Trails Plan, and the Bicycle Plan are developed and implemented, EAZs will continue to be used to guide plan development, project initiation, and infrastructure investments, with the intent of equitably distributing the benefits that pedestrian crossings, sidewalks, bikeways, and urban trails provide and mitigating disproportionate burdens already placed
on underserved communities.
What we heard
Throughout the ATX Walk Bike Roll process, concerns about affordability and displacement were shared—especially by People of Color and people with low incomes. Policies to address these issues and keep transportation affordable are essential to peoples’ ability to happily live and thrive in the city. In the words of one community member, people are "concerned that urban trails and sidewalk improvements are benefiting wealthy white residents...that People of Color and low-income residents are being pushed out, and that People of Color will not be around in 5-10 years from now, after additional improvements to sidewalks, bike lanes, and urban trails."
Equity of Recent Sidewalk Investments
The 2009 Sidewalk Plan established a new prioritization approach for expanding and maintaining the sidewalk network. The model emphasizes affordable housing, population density, areas below median household income, and public health indicators (in addition to multiple other factors). The result is that the City of Austin has prioritized building and repairing sidewalks in neighborhoods that are now identified as Focus EAZs. Analysis performed for this 2023 Plan shows this approach has yielded sidewalk connectivity and condition within Focus EAZs that is as good or slightly better than other parts of the city. However, there is still much work to be done to address equity in the City of Austin transportation networks. As of 2022, only 32% of the sidewalk network is in a functionally acceptable condition whereas the street network is in 76% fair to excellent condition and while the street network provides vehicular access citywide the pedestrian network is still far from complete.
1.2. Austin Strategic Mobility Plan
The Austin Strategic Mobility Plan (ASMP) is a comprehensive long-range transportation plan that establishes a vision for Austin’s multimodal transportation network. It calls for decreasing the percent of people who drive alone to work to 50 percent by increasing the percent of people who walk, bike, take transit, carpool, or avoid commuting by working from home to 50 percent.
This 2023 Sidewalks, Crossings, and Shared Streets Plan supports the ASMP’s mobility goal and its overall vision by planning ways to enhance Austin’s pedestrian network so walking is a viable form of mobility.
The ASMP includes numerous mobility-related policies. Specific policies that both shaped the development of this Plan and that this Plan helps to support include (but are not limited to):
Mobility-Related Policies:
| Pedestrian Network Policy #1: | Complete the pedestrian network | Provide safe, comfortable, and accessible pedestrian passage along and across every public street to provide safe, equitable access throughout all of Austin. |
| Pedestrian Network Policy #2: | Make the sidewalk system accessible and comfortable for all |
Implement sidewalk system projects and complementary transportation investments that increase accessibility to, and comfort using, the sidewalk system. |
| Pedestrian Network Policy #3: | Maintain the usability of the sidewalk system |
Proactively maintain and provide incentives to ensure our existing sidewalk system is functional and clear of obstructions. |
| Pedestrian Network Policy #4: | Ensure new development connects to the sidewalk system |
Promote and incentivize the expansion of the sidewalk system through new development and site redevelopment. |
| Roadway Policy #6 | Support streets as places where people and community engage in non-mobility activity |
Recognize the diverse and expanding civic needs within our right-of-way and promote adaptive uses of the street. |
| Public Transportation System Policy #6 |
Improve access to public transportation |
Supply infrastructure to provide safe, expanded, and seamless multimodal access to public transportation. |
| Affordability Policy #2 | Reduce transportation costs as a component of household affordability |
Ensure that all voices are represented, especially those of historically underserved and underrepresented communities, throughout the planning, development, provision, and operation of the transportation network. |
| Urban Trail Policy #3 | Pursue opportunities to connect to and expand the Urban Trail System |
Reduce personal costs associated with car ownership by offering more choices in how we travel. |
| Accessibility Policy #3 | Ensure sidewalks are safe and accessible for people with mobility impairments |
Recognize that children, seniors, and people with mobility impairments face disproportional difficulties when sidewalk infrastructure is not properly provided, operated, and maintained. |
| Public Health Policy #1 | Recognize that transportation fatalities and serious injuries are a public health crisis |
Holistically address fatalities and serious injuries on the transportation network as a public health issue. |
| Public Health Policy #3 | Provide infrastructure and programming to encourage active lifestyles and healthy living |
Recognize active transportation’s contribution to preventing and managing chronic diseases and supporting physical and mental well-being for people of all ages and abilities. |
| Public Interaction Policy #2 | Engage community members in transportation decisions |
Include interested and affected community members when making decisions in the planning, design, construction, and operation of transportation projects and programs. |
| Collaboration Policy #6 | Work with the community to incorporate public art and beautification into transportation infrastructure |
Reflect our community values and make places more inviting by incorporating public art into the transportation network. |
| Financial Strategies Policy #1 | Ensure long-term, viable funding models to plan, finance, and maintain the transportation network |
Identify and implement sustainable funding strategies to supply, operate, and maintain transportation assets and programs that meet the community’s mobility needs. |
| Financial Strategies Policy #2 | Operate in a fiscally responsible manner |
Be responsible stewards of public resources in the design, construction, operation, and maintenance of the transportation network. |
1.3. Context
Prior to the 1990 Americans with Disabilities Act (ADA), sidewalks and other pedestrian accommodations were considered optional. In 2000, the City of Austin proactively began repairing and rehabilitating the sidewalk network in the public right-of-way, as well as building additional sidewalks along existing streets to
fill gaps. This 2023 Sidewalks, Crossings, and Shared Streets Plan incorporates many elements of the 2009 and 2016 sidewalk plans, including the data-driven, equity focused prioritization process developed as part of the 2009 Plan.
The 2023 Plan focuses on the management and expansion of sidewalks, shared streets, and pedestrian crossing infrastructure and serves as the ADA Transition Plan for City of Austin sidewalks within the public right-of-way. This Plan also identifies the need for the City of Austin to develop an ADA Transition Plan for pedestrian crossings on City of Austin streets. In addition to what is covered by this Plan, there are other elements and facets that influence pedestrian comfort and safety (such as programs and urban design). This Plan is not intended to address those topics.
The analysis and recommendations in this update are inclusive of the existing city limits and do not include information for areas within Austin’s extraterritorial
jurisdiction. Maps and data contained in this report are based on a snapshot of the best available sidewalk data as of October 2022.
1.3.1. Complementary Planning Guidance
While the 2023 Sidewalks, Crossings, and Shared Streets Plan is principally focused on network management of sidewalks, shared streets, and pedestrian crossings, the Plan aligns with other planning guidance to provide for the safe movement of people walking and rolling in the City of Austin:
- The 2016 Vision Zero Action Plan identified several actions that support the goals of the 2023 Sidewalks, Crossings, and Shared Streets Plan focused on reducing speeds, improving crossings, coordinating with transit stops and school sites, and implementing targeted education initiatives.
- The 2018 Pedestrian Safety Action Plan includes a pedestrian safety analysis and recommendations for engineering, education, enforcement, and encouragement strategies to reduce pedestrian fatalities and serious injuries.
- The Bicycle Plan, Urban Trails Plan, and the Community Health Improvement Plan contain complementary strategies that support the goals of the 2023 Sidewalks, Crossings, and Shared Streets Plan.
Previous engagement efforts
The 2023 Sidewalks, Crossings, and Shared Streets Plan was built upon a strong foundation of community input from previous planning efforts. In particular,
the Austin Strategic Mobility Plan (ASMP) included four phases of engagement that actively connected with the entire community, with specific focus on those that
had been previously missing. Critical voices from historically underrepresented and underserved populations guided the ASMP, including People of Color, seniors, youth, and people with disabilities.
However, in a survey performed at the beginning of the ATX Walk Bike Roll process, 55% of respondents (61% of focus population respondents) said they had NOT participated in a public process (such as a meeting or survey) where decisions about trails, sidewalks or bikeways had been made.
Therefore, additional input from the community was vital to guide the development of the 2023 Plan, building upon previous input related to pedestrian priorities. Summaries of the input are provided in Appendix A4, A5, and A6.
"I am pleased to see the efforts and progress Austin is making in becoming more bike and pedestrian friendly. However, we have a long way to go." — Community member input, October 2021
1.3.2. ADA Requirements
The Americans with Disabilities Act of 1990 mandates in Title II, Subpart A, that public entities establish and maintain a Transition Plan to achieve full accessibility of existing public infrastructure, including existing sidewalk and crossings within public right-of-way.
Figure 1-5. Key Requirements for ADA Transition Plan
| ADA Transition Plan Requirement |
|---|
| Inventory of physical barriers and proposed methods to remove them |
| Schedule for barrier removal |
| Public official responsible for plan implementation |
| Proposed funding source for improvements |
| Opportunity for individuals with disabilities to provide input |
Sidewalks and Shared Streets
2.1. Sidewalks
Sidewalks are an essential component of Austin’s transportation network. A connected sidewalk system provides pedestrian routes from Point A to Point B and enables people to connect to transit for longer trips. Beyond transportation, sidewalks provide "numerous health benefits associated with active lifestyles and can help foster a dynamic public realm that makes commercial districts and neighborhoods vibrant places to be."1
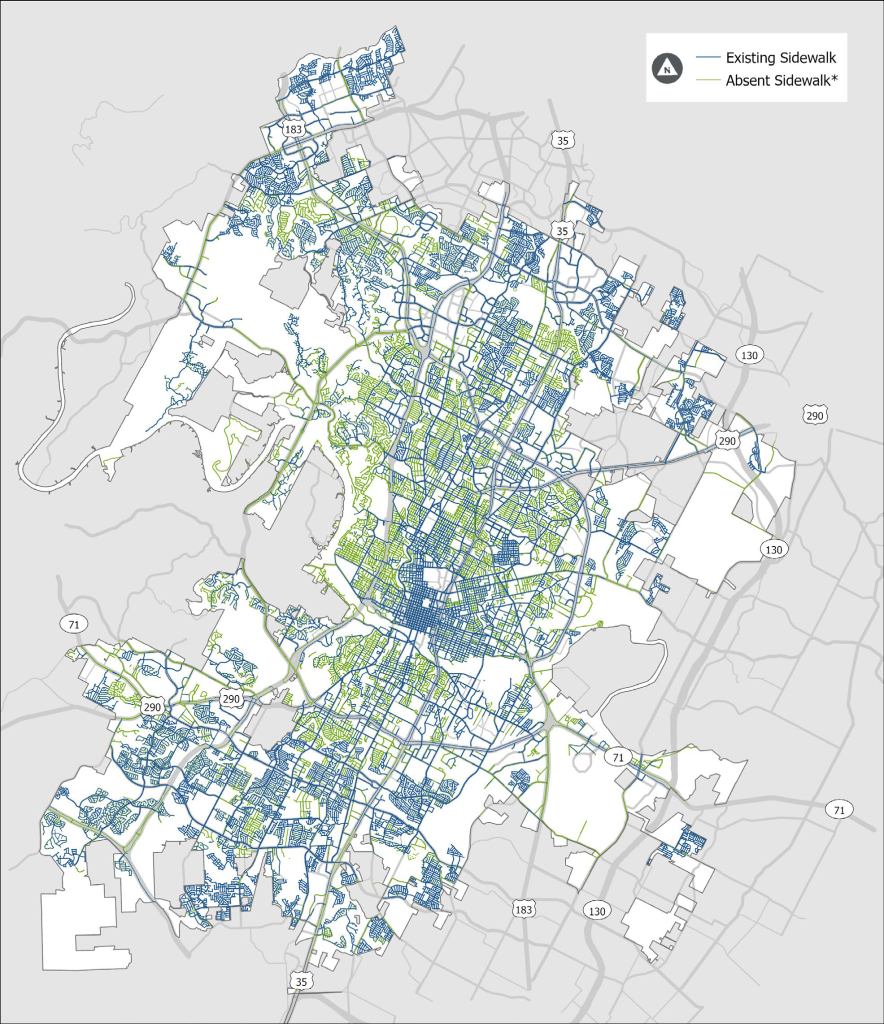
 The City of Austin has been actively expanding the sidewalk network for two decades. However, the sheer volume of streets without sidewalks—the result of more than a century of not requiring sidewalks to be built on all streets—means that many gaps still exist. The 2016 Sidewalk Plan introduced a new approach whereby sidewalks are provided on one side of low-traffic residential streets for retrofit projects.2 But even with the construction of 400 miles of sidewalk since then (many of these were a result of new development), there are still approximately 1,500 miles of “absent” sidewalk.3 If the historic pace of implementation continues, it could take up to 100 years to build sidewalks along all streets in Austin. Figure 2-1 illustrates the scale of this challenge.
To more quickly increase access and connectivity for people walking and rolling, the 2023 Plan establishes a new approach to completing the pedestrian network through a combination of sidewalks and shared streets.
This chapter also includes sections on maintaining the existing sidewalk network and compares the utility of the existing sidewalk network to the utility of a more complete network. This is measured by the percentage of properties in the city that are connected to the pedestrian network, as well as the percentage of key destinations that can be accessed via the network. This is the first time this has been assessed citywide in Austin, and this analysis provides the City with an additional tool for assessing gaps in network coverage and expanding access to key destinations.
What we heard about sidewalks
Survey respondents indicate they would walk more often if sidewalks were continuous and in better condition, especially in high-traffic areas. In the words of one community member, "Sidewalks on both sides of every major street seems more critical than anything else."
Several respondents noted that not all bus stops have sidewalks or an accessible route to get to the bus stop.
1 Austin Strategic Mobility Plan
2 Sidewalk is required on both sides of new residential streets.
3 The mileage of “absent” sidewalks equals the amount of sidewalk needed to provide continuous sidewalks on one side of existing residential streets and both sides of other existing streets.
Snapshot of the current sidewalk network:
- 2,800 miles of existing sidewalk
- Approximately 1,500 miles of absent sidewalk*
- 61% of properties are on streets with existing sidewalks*
- 51% of properties are connected by sidewalks to schools**
- 35% of properties are connected by sidewalks to transit**
- 20% of properties are connected by sidewalks to groceries and other food sources**
*City policy is to address sidewalk gaps on both sides of arterial and collector streets, and on one side of existing residential streets. Streets labeled as “absent sidewalk” do not meet these conditions.
**Percent of properties within two miles of a school, 0.25 miles of a transit stop, and 0.25 miles of a place to buy groceries that are connected to those places by the existing sidewalk network.
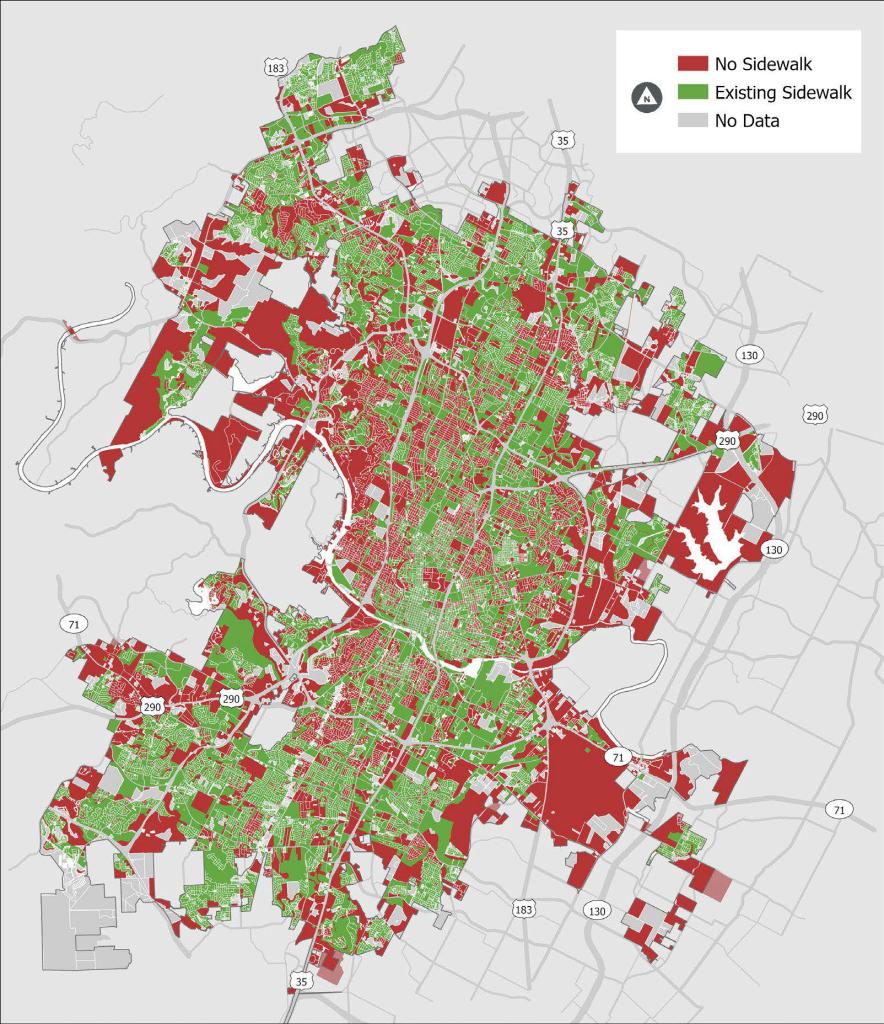
Figure 2-1. Snapshot of the Current Sidewalk Network
2.2. Shared Streets
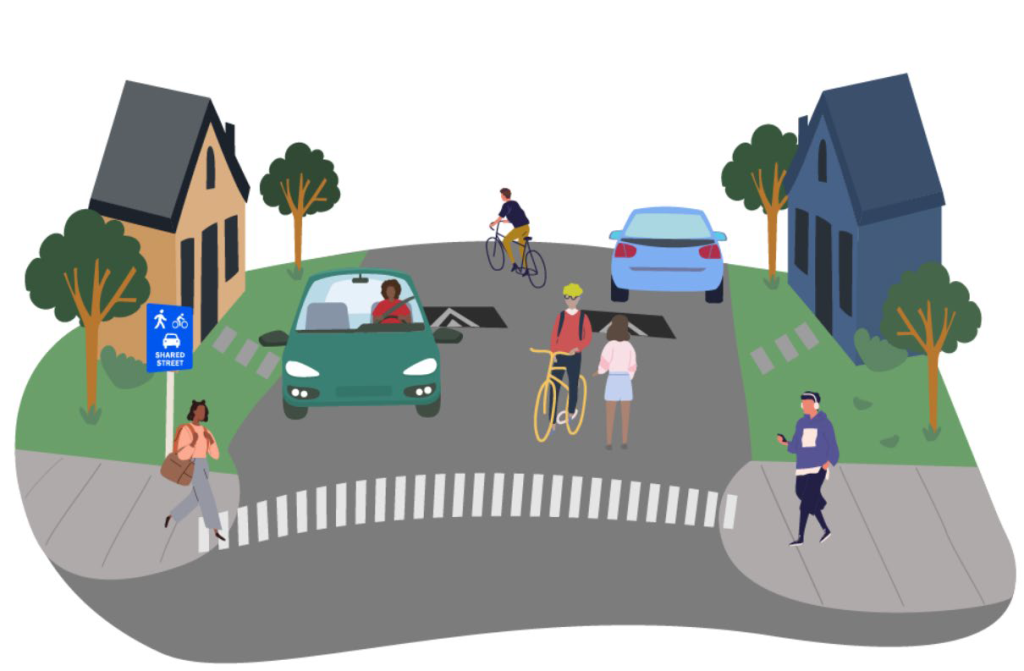
The term “shared streets” refers to an environment where people walking, bicycling, and driving share the same space in a way that prioritizes the safety and comfort of pedestrians while allowing for movement of bicycles and motor vehicles. Shared streets are a potential alternative for improving pedestrian access in existing neighborhoods that were developed without sidewalks; and shared streets may be a preferred alternative for aesthetic, social, or environmental reasons, or where construction of sidewalks would be particularly difficult. Shared streets are applicable primarily as a retrofit solution in existing communities, as opposed to new development areas. Widespread implementation of shared streets in existing neighborhoods will help complete the pedestrian network faster and more economically than building out sidewalks on one side of every local street.
Many local streets without sidewalks already function as shared streets now. Key principles of shared street design include:
- Designing for Slow Speeds: Use traffic calming devices to slow traffic, such as curb extensions, signs, markings, or other treatments as outlined in the City’s Traffic Calming Toolkit.
- Establishing Gateways: Implement clear demarcations of a transition from a conventional streetscape to a shared street,through treatments such as curb extensions,reduced pavement or lane width, and signage.
- Evaluating Effectiveness: Collect "before" and "after" data on speed, volume, crashes, rates of walking and bicycling and social impacts to help determine the effectiveness of shared streets, and implement changes to continue to improve mobility, safety, and connectivity.
The Sidewalk Program estimates it can install three to four blocks of shared streets for the same cost as installing one block of sidewalk. In addition to the financial benefit of adding more miles to the pedestrian network with limited funds, shared streets also have several environmental benefits.
Environmental Benefits of Shared Streets
- Enhance tree cover by preserving established landscapes and by adding new trees and green space in curb extensions to calm traffic. The provision of trees and shade is an equity issue.The area east of I-35 has less than half of the tree canopy compared to the area west of I-351.
- Reduce impervious cover and improve stormwater infiltration by removing excess pavement at intersections andadding native plants or rain gardens.
- Lower the City’s carbon footprint. The process of making concrete involves high temperatures and burning large quantities of fossil fuels. One 2019 study found that cement production accounts for 7% of all greenhouse gas emissions worldwide.
1 https://www.esri.com/about/newsroom/blog/austins-map-of-tree-equity/
What we heard about shared streets
In addition to testing the concept via pilot projects and collecting feedback (described below), citywide surveys and pop-up tabling at community events were used to explain and gather feedback on the concept.
Overall, 80% of respondents said they strongly support or somewhat support the concept of shared streets. 82% of focus population respondents said they strongly
or somewhat support the concept.
2022 Shared Streets Pilots: From Identification to Installation
 Throughout 2022, staff from Transportation and Public Works met regularly to design and implement a Shared Streets Pilot Program. The pilot program provides an avenue to test different shared street designs in multiple locations throughout the city and better understand how shared streets can be used to complete the
pedestrian network. These pages outline the steps of the pilot development process.
Review best practices
The first step in the process was a review of best practices for shared streets and alternative pedestrian facilities in other U.S. cities, including Boulder, CO; Portland, OR; San Francisco, CA; and Seattle, WA. The review focused on street selection criteria, public engagement techniques, accessibility, street design, and implementation strategies that would help initiate the City of Austin’s Shared Streets Program.
Identify candidate streets
The next step was using data on sidewalks and street level classifications to identify low-speed, low-volume streets without sidewalks that would make good potential locations for these pilot projects. Approximately a dozen candidate sites were selected and a postcard survey was mailed out to gauge interest. Based on the results four locations were selected to move into the next public engagement phase. Two of the locations were within Focus EAZs, and two were outside
the Focus EAZs.
Hosted pop-up events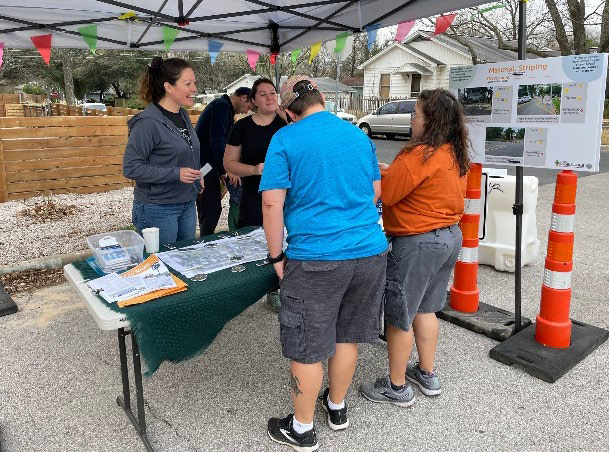
The City hosted pop-up events for the four pilot project locations in Spring 2022. The City installed yard signs to alert neighbors about a pop-up meeting on their street. During the popup, City staff used cones to set up temporary traffic calming measures to demonstrate street changes and staffed a table
to respond to questions, gather feedback, and gauge community support for shared streets.
Community support for shared streets varied among the four pop-up locations. Two locations with minimal design challenges were moved into the design phase, while the other locations warrant further study to address the traffic safety concerns raised by community members at the pop-ups. This is demonstrated by some quotes from participants, shown below.
Community comments
"I appreciate the way this program reclaims streets for kids, cyclists, walkers, etc. – cars aren’t the only priority."
"Prefer shared street over sidewalk in a heartbeat."
"Mixed feeling on shared street. Afraid it gives walkers false sense of security and afraid of hitting them."
"We love the way our street looks, but cars do go very fast and if there was a way to slow them down without all the lines and speed bumps it would be great."
"Lack of sidewalks [and] having to constantly keep an eye out on approaching vehicles is often uncomfortable."
Advance designs for two locations
City staff moved ahead with shared street designs for two locations in summer 2022: Avenues G and H between 51st and 56th Streets, and Ullrich Avenue between Arroyo Seco and Joe Sayers Avenue. The design for Avenues G and H feature traffic calming devices such as neighborhood traffic circles and curb extensions at regular intervals. The design for Ullrich Avenue focuses on narrowing the entrances to the street with planted curb extensions, which will reduce impervious cover.
Both designs include a signature blue “Shared Streets” sign at each entrance to the shared streets.
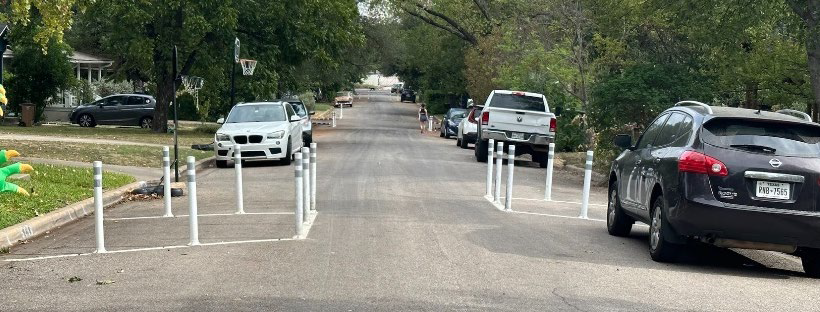
Install Shared Street designs
Signage and traffic calming devices were installed on Avenues G and H from 51st and 56th Streets in late September 2022. The temporary designs remained in place for six months. A more permanent shared street design was then installed on Ulrich Avenue.
Evaluate and provide method for community feedback
At the time this Plan was being finalized, both pilots were still in operation and will continue to be evaluated by staff observation and community feedback to help determine how well they worked. If pilot projects produce the desired outcomes and continue to have the support of residents along the street, the design changes will remain in place longer than six months and temporary materials will be replaced with more permanent ones (such as concrete).
2.3. Completing the Network
The City’s objective is to complete the pedestrian network, which requires building an additional approximately 1,500 miles of sidewalks and shared streets in Austin. The cost and timeframe required to complete the network is significant. This section presents the methods used to evaluate how to approach implementation and identify priorities given real-world constraints on time and funding.
2.3.1. Evaluating Needs
With this 2023 Plan, the City has new analytical tools to evaluate the utility of the pedestrian network, defined as the degree to which it connects homes, businesses, schools, services, transit, and other places people need to go on a daily basis. Two tools—Network Coverage and Network Access—were developed with this Plan to evaluate current conditions and provide a process for the City to evaluate progress as the network is built out and Austin continues to grow.
 Network Coverage
The network coverage analysis is designed to answer: “What locations currently have adequate pedestrian coverage?” In Austin, adequate sidewalk is defined as sidewalks on both sides of arterial and collector streets, while some local residential streets only need sidewalk on one side. With the addition of shared streets to the pedestrian network, some local streets may not have sidewalks at all, and instead receive traffic calming and signage to provide pedestrians with a comfortable place to walk.
The coverage analysis evaluates parcels of land, as defined by registered property boundaries. A parcel is either served by the pedestrian network (i.e., connected to an existing sidewalk) or not served. The coverage analysis does not account for the condition of existing sidewalks.
Figure 2-4. Map of existing sidewalk network coverage. Parcels on streets with complete sidewalks are green. Parcels on streets without complete sidewalk are red. Grey parcels are not directly adjacent to streets.
Network Access
The network access analysis answers the question: “How many locations have access to a given type of destination via the pedestrian network?” The answer is a product of immediate access to the walking network and also the continuity of the network.
The access analysis builds on the coverage analysis and also uses parcels of land as the unit of analysis. Access is defined as having a continuous pedestrian route from the parcel to a specific type of destination within a distance that is considered walkable. The tool can be used for a wide variety of destination types. To evaluate current conditions, three important destination types were evaluated using common walking distances. The results are recorded in Figure 2-5.
Together, the results of these analyses show that the current sidewalk network does not support a significant proportion of potential walking and rolling trips. For example, only 51 percent of parcels within two miles of a school have continuous pedestrian access to that school. Notably, however, parcels within Focus EAZs have somewhat better access to these three destination types.
What we heard about sidewalk coverage and access
An ATX Walk Bike Roll survey asked participants about their perception of equality in access to safe and comfortable places to walk, bike, and/or roll. Most participants described perceptions of unequal access, identifying a pattern of better infrastructure in wealthier, whiter, and gentrifying neighborhoods and worse infrastructure in neighborhoods with lower-income communities of color. Sidewalk condition was a commonly noted aspect of this inequality.

2.3.2. Sidewalk and Shared Street Network Plan
Continuing to build and enhance sidewalks on major streets and in commercial areas will remain a priority. In addition, based on evaluation of three scenarios and public input, the City of Austin has determined that shared streets can be provided instead of sidewalks on a significant portion of low-traffic neighborhood streets and can help to meet the need for an additional approximately 1,500 miles of pedestrian network. By incorporating shared streets as a key element of network completion, the total cost and implementation timeframe can be significantly reduced. Based on an evaluation of land use, right-of-way, and traffic conditions, the City of Austin has determined that a total of approximately 740 miles of street frontages are good candidates for shared streets instead of sidewalks.
There are three primary elements of the sidewalk and shared street network plan:
- Existing Sidewalks - Any constructed sidewalk within public right-of-way, regardless of physical condition or accessibility compliance. Maintenance, repair, and replacement of existing sidewalks is described in Section 2.4.
- Planned Sidewalks – Street frontages where sidewalks are currently missing but are needed to provide safe pedestrian access to commercial areas, transit stops, schools, community centers, parks, and other important community destinations.
- Planned Shared Streets – Local residential streets with lower traffic volumes that are typically missing sidewalks on both sides.
What’s the right mix of sidewalks and shared streets?
Public engagement in fall 2022 defined shared streets and their benefits and asked Austinites to help determine the appropriate mix of sidewalks and shared streets the City should build in the next 20 years. Three scenarios were presented:
- Mostly Sidewalks – If we continue to focus on mostly building sidewalks, then most neighborhoods will only have sidewalks along major streets and near commercial areas and transit, with some neighborhood streets getting sidewalks on one side.
- An Even Mix – If we also build shared streets, then busier streets and areas with higher amounts of walking activity would continue to get sidewalks, but we would also cover more neighborhood streets with shared streets.
- Lots of Shared Streets – If we invest more heavily in shared streets, then we’ll be able to cover more neighborhood streets across Austin. Major streets and streets with lots of walking activity will still get sidewalks.
80% of respondents (82% of focus population respondents) strongly or somewhat supported the concept of shared streets, compared to 15% (10% of focus population) who strongly or somewhat opposed the concept. Most respondents (41%) preferred Scenario 3. Lots of Shared Streets (Scenario 2. An Even Mix: 36%. Scenario 1. Mostly Sidewalks: 17%). Considering only the responses from People of Color and people with lower incomes, 41% preferred Scenario 3, 40% preferred Scenario 2, and 15% preferred Scenario 1. More detail about the Network Scenarios is provided in Appendix D.


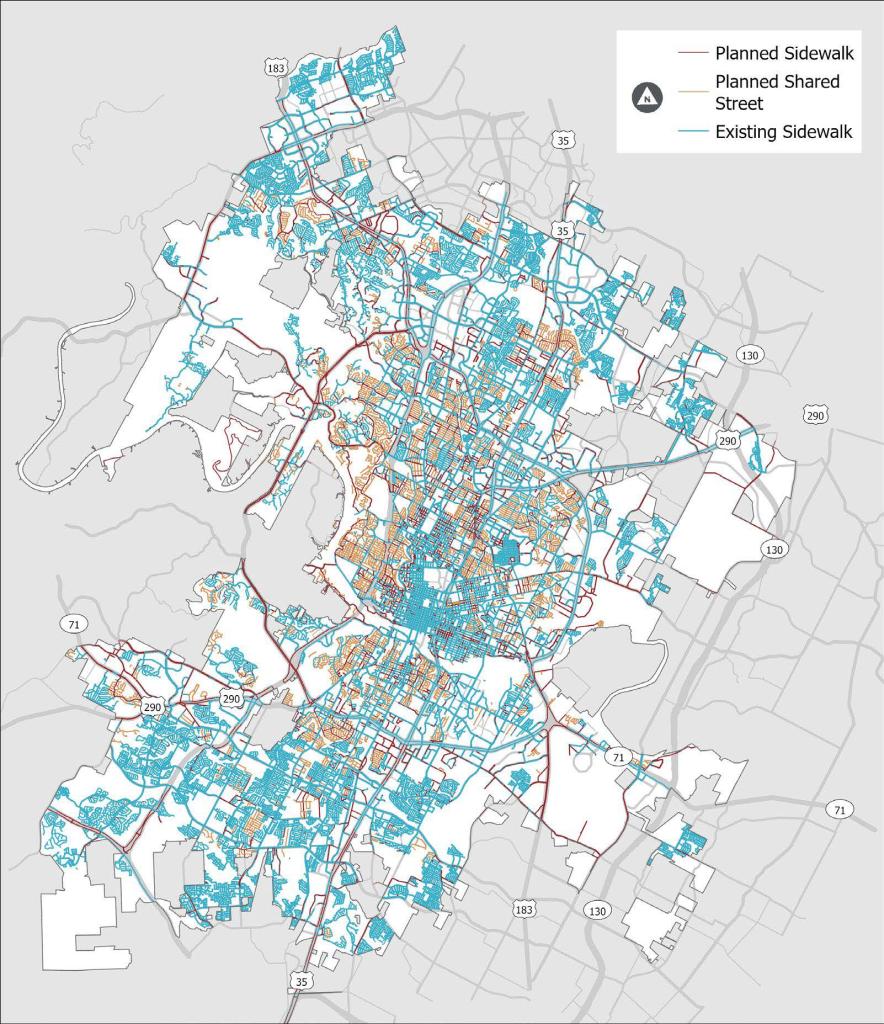
Figure 2-6 shows that Austin’s pedestrian network is 64 percent complete. The remaining 36 percent of the network is composed of planned sidewalks and planned shared streets, described above. The existing and planned pedestrian network is mapped in Figure 2-7.
As shown in Figure 2-8, construction of all approximately 1,500 miles of planned sidewalks and shared streets in the network would cost approximately $903 million (based on historical new sidewalk construction costs and estimated shared streets costs).1 The current budget for new sidewalk construction is approximately $10 million per year. At this funding level, full build out would take over 90 years.

1 Opinions of probable cost were developed by establishing rough quantities to determine a rough order of magnitude cost. These costs can vary widely depending on the exact details and nature of the work. The overall cost opinions are intended to be general and used only for planning purposes. Toole Design Group, LLC makes no guarantees or warranties regarding the cost estimate herein. Construction costs will vary based on the ultimate project scope, actual site
conditions and constraints, schedule, and economic conditions at the time of construction.
2 Mileage and per mile cost for shared streets are calculated per frontage mile in this table. 740
miles of shared street frontage equates to 370 street centerline miles.
2.3.3. Sidewalk and Shared Street Project Selection
The sidewalk and shared street network plan establishes the breakdown of facility types
(i.e., how much of the complete network will be sidewalks versus shared streets). The next step in the process is to identify3 which sidewalk and shared street projects to build first. The prioritization methodology from the 2009 and 2016 Sidewalk Plans has been carried through in this update (see Appendix F). The prioritization factors and weights had been thoroughly vetted by stakeholders previously, and have been effective in equitably directing resources to the areas of the city with the most need.
A few minor updates were made as part of the 2023 Plan, including:
- Removing bonus points awarded for sidewalks identified in a neighborhood plan. Not all areas in Austin have a neighborhood plan, and eliminating this bonus is consistent with City policy that there should be safe pedestrian access along every public right-of-way.
- Using updated data from the Centers for Disease Control (CDC) PLACES database to create a more consistent and up-to-date data set for the pedestrian health and safety status input.
- Making adjustments to the granularity of previous scores. All planned sidewalk segments on both sides of a block now receive the same prioritization score.
See Appendix G for a map of planned sidewalk and shared street priorities. Each year the Capital Improvement Program (CIP) budget provides funding for a relatively small fraction of the Very High and High priority planned sidewalks and shared streets identified on the prioritization map. To select projects, the Sidewalk Program looks for opportunities to coordinate with additional programs to better leverage funding and address multiple City priorities at once. Additional opportunities could be present through:
- Project Connect
- Imagine Austin Centers and Corridors
- Other City projects, such as street maintenance, utility improvements, and facility access improvements
- 311 and ADA access requests
- Connectivity and ADA compliance near new Pedestrian Hybrid Beacons (PHBs) and other pedestrian signal improvements
- Bicycle program projects, particularly in constrained locations where reallocation of existing right-of-way may be required
- Transit projects in addition to Project Connect, such as improvements with new or relocated CapMetro stops, with priority for high volume transit locations, special use routes, or CapMetro paratransit priority locations
- Network connectivity, such as urban trails
- Safe Routes to School Program
- Small Area Planning and Neighborhood Partnering Program
- Development, including private and affordable housing
- ADA access to Parks and Recreation Department facilities
- Agency coordination with TxDOT and Central Texas Regional Mobility Authority (CTRMA)
- Coordination with the City’s Vision Zero Program
- Coordination with City programs/departments such as Community Tree Preservation Division Development Services Department (DSD) and their Urban Forest Grant Program, Office of Sustainability Climate protection, Food System, Green Business Leadership and Eco district programs and associated grants, and Art in Public Places Program
- Recommendations of the Joint Task Force (county, city, AISD)
- Recommendations on Family and Children
and Educational Impact Process
What we heard
“Filling in unconnected sidewalk gaps/ properties should be a priority for neighborhoods…Combine any new road/path plans with street trees and foliage to mitigate the Austin heat island and to make walking more pleasurable.”
—Community member comment, October 2021
Shared Street Selection and Installation
The process for selecting and installing shared streets differs from that of installing sidewalks. In addition to the prioritization score and the factors
listed above, shared streets implementation requires a greater degree of intra-departmental coordination between the Sidewalk Program and the other mobility programs. Areas of coordination include assessing traffic conditions and potential impacts, evaluating and addressing pavement quality, installing and maintaining signs and pavement markings, potentially adjusting on-street parking, and most importantly engaging with local residents at a neighborhood scale to ensure the choice to install shared streets instead of sidewalks is supported by the local community.
What we heard
Safety is a key reason to expand the sidewalk and shared street networks. In a survey, 69% of respondents (76% of focus
population respondents) say a top concern is that they don’t feel safe near fast-moving motor vehicle traffic and 53% (56% of focus population) say a top concern is lack of connections in trails, bikeways, and/or sidewalks.
Equity & Pedestrian Safety
Vulnerable road users in Austin make up a disproportionate share of serious injury and fatal crash victims. Only 3% of total crashes involve pedestrians, but pedestrian-involved crashes account for 17% of serious injury and fatal crashes (Austin Strategic Mobility Plan). The impacts are even more profound for Black and Native American populations who are involved in serious injury and fatal pedestrian crashes at more than twice the frequency as expected based on the composition of the general population. The ATX Walk Bike Roll Crash Analysis is provided in Appendix C.
2.3.4. Funding
The purpose of this section is to quantify the need for additional funding. New sidewalk construction in Austin typically occurs by one of three methods:
- as part of private development by subdivision or site development,
- as part of a Capital Improvement Program (CIP) street or utility project, or
- by a City Sidewalk Program CIP project.
For the City Sidewalk Program CIP, the majority of funding comes from Austin’s Mobility Bonds, with limited additional funding from fee-in-lieu, grants, and other sources. The 2020 Mobility Bond provides a total of $80 million for sidewalks with a focus on sidewalks over six years, including $50 million for new sidewalks and $30 million for sidewalk rehabilitation.
The $50 million dedicated to expanding the pedestrian network combined with other currently identified funding sources is anticipated to provide less than half the estimated funding required to meet plan goals (see Figure 2-9) through 2028. Significant levels of additional funding and a more concerted effort to implement the City of Austin Complete Streets Policy will be necessary to fully implement this plan.

2.4. Maintaining the Network & ADA Transition Plan for Sidewalks
Maintenance of existing sidewalks within public right-of-way has historically been considered the responsibility of the adjacent property owner. The City of Austin Code included this responsibility requirement until 1999. Subsequently, the City implemented a repair and rehabilitation program for its sidewalk network, but funding levels do not sustain a serviceable sidewalk network given life-cycle costs and previous years of deferred maintenance. The Transportation and Public Works Department is currently responsible for maintaining approximately 2,800 miles of existing sidewalk network. Existing sidewalk repair and rehabilitation is also mandated by the Americans with Disabilities Act (ADA).
2.4.1. Current Program
Prior to the late 1990s, little or no City funding was devoted to sidewalk repair and rehabilitation.
Starting in 1998 and again in 2000, transportation bonds were approved that included sidewalk funding. From 2006 to 2014, the City spent roughly $1 million of bond-funding annually on sidewalk repair and rehabilitation. The 2016 Plan identified an annual need of $15 million (32 miles per year) of sidewalk repair. Since 2016, the City has repaired and rehabilitated approximately 15 miles of sidewalks per year—a result of inadequate funding and increases in construction costs. In addition to this spending, the Transportation and Public Works Department Sidewalk Program has historically performed repair and rehabilitation as “ADA transition” projects, combining installation of new sidewalks with rehabilitation of existing sidewalks to complete ADA compliant routes between destinations. However, because these ADA transition projects are focused on installation of sidewalk gaps, they do not always address the most critical repair and rehabilitation need. A stable and sufficient funding source for ADA transition projects and sidewalk repair and rehabilitation is needed to ensure a functional pedestrian environment.
Poor Sidewalk Conditions Limit Accessibility 
A condition assessment performed as part of the 2016 plan determined 80% of existing sidewalks in Austin are functionally deficient, rendering them unusable by many people with disabilities. According to the U.S. Census Bureau, around 6.7% of Austinites under age 65 live with a disability. This statistic may underestimate due to lack of professional diagnoses, discrepancies in self-reporting, and definitions of disabilities. In addition, most people experience a temporary disability (e.g., using crutches) at some point in their lives. For people with a disability that impacts mobility, a sidewalk that is obstructed or in poor repair can represent a barrier that is insurmountable. Without an accessible sidewalk network, many people with disabilities have limited alternatives for getting where they need to go. Some people may choose to walk or roll in busy streets, which creates a risk both for them and for drivers. Others may choose paratransit services, such as MetroAccess, although these services are costlier to provide than traditional public transit and often inconvenient. Still others may choose not to make a trip they would otherwise undertake if the sidewalk were in better shape, which has profound implications on employment, health, and meeting daily needs.
The City of Austin maintains the pedestrian network using a variety of different approaches and processes, described below. 
Vegetation Obstructions – Vegetation impacts the ADA compliance and functionality of sidewalks by creating hanging protrusions and ground obstructions. City Code requires property owners to maintain vegetation and non-public trees above or adjacent to sidewalk within the right-of-way. The Transportation and Public Works Department Urban Forestry Program pro-actively addresses vegetative sidewalk obstructions in response to the 3-1-1 customer service request system and through an ongoing inspection, notification, and enforcement program. Combined with public awareness campaigns the pro-active vegetation maintenance program has been critical to improving the condition of sidewalks in Austin.
Spot Replacement – There are no cost effective, preventive maintenance methods to completely address ADA noncompliance along a pedestrian route. As a result, removal and replacement is the typical remedy. There are however a few types of defects that can be repaired through alternative methods.
Lifting and Grinding/Cutting – The City sometimes uses concrete lifting and concrete grinding or cutting to increase the functionality of a sidewalk for a fraction of the cost of replacement. These methods do not generally bring a sidewalk into full ADA compliance; however, they increase functionality by removing trip hazards and cross slope faults. Because of the economy of these alternative methods, they are currently used to address faults within areas where there have been a significant number of citizen repair requests. If needed, these alternative maintenance methods are sometimes followed by spot replacement of remaining problem areas.
Curb Ramps and Street Alterations – In 2013, the Department of Justice and Federal Highway Administration provided guidance regarding the installation of curb ramps in conjunction with asphalt overlays and other street “alterations.” While implementing this guidance on street maintenance resurfacing projects, the City also seeks to ensure that new curb ramps connect to a functional ADA route. To the extent that resources are available, new curb ramp installations are coordinated with sidewalk rehabilitation and applicable street alterations. In addition to street maintenance resurfacing projects performed by Transportation and Public Works, other City Departments may resurface streets as part of utility or Capital Improvement Projects, which also requires coordinated curb ramp installations.
Driveways – When the requirement for sidewalk repair and rehabilitation responsibility by the adjacent property owner was removed from the City of Austin Code in 1999, Transportation and Public Works adopted a policy that driveways would still be the responsibility of the property owner because they provide direct vehicular access from private property to the right-of-way. Because the driveway crosses the pedestrian route, any newly constructed driveway is required to include an ADA compliant sidewalk section. Currently this policy is waived when driveways are replaced during a sidewalk project, the City installs new ADA compliant driveway aprons at no cost to the property owner. Driveway replacement accounts for approximately 20% of sidewalk repair and rehabilitation project costs.
Shared Streets – Shared streets are a new approach to providing pedestrian passage on low-traffic neighborhood streets in Austin. Designs of shared streets may include signs, rigid or flexible bollards, speed cushions, mini traffic circles, chicanes, curb extensions, and more to mitigate automobile speed. These features can be constructed of lightweight materials installed rapidly or made from more durable concrete, and may include vegetation. In addition, shared street projects are opportunities to collaborate with communities to provide spaces for public art, edible landscaping, and play. This diversity of design treatments means maintenance will have unique requirements. The City will need to evaluate maintenance needs and develop long term strategies.
2.4.2. Project Selection
The City of Austin identifies sidewalk repair and rehabilitation projects with the goal of providing a functional pedestrian route along an entire block or series of blocks. Projects are selected based on a systematic sidewalk condition assessment program and objective prioritization of existing sidewalks. The prioritization method is the same as used for new sidewalk and shared streets (described in Section 2.3.3). See Appendix G for a map of existing sidewalk priorities and existing sidewalk conditions. In addition to condition assessment and prioritization, selection of sidewalk repair and rehabilitation projects will include additional priorities and coordination opportunities similar to those outlined in Section 2.3.3 to maximize effectiveness of available funding. Inventory of Physical Barriers The City of Austin condition rating system is used to apply a rating of A through F to each sidewalk segment, curb ramp, and driveway, based on the worst severity condition, such as cross-slope, cracking, etc. Sidewalk segments are defined between intersections and driveways. Figure 2-11 describes the rating system and Figure 2-12 provides an example of the conditions that are evaluated for each sidewalk segment and how the condition impacts the rating.

Schedule for Barrier Removal – Prioritization of Improvements 
Prioritization of ADA barrier removal for existing sidewalks will include a combination of locational priority and the condition rating. For example, repair priority will be given to areas that have a large majority of D- and F-rated sidewalks within Very High and High priority areas to address the most significant ADA barriers in the most critical areas. Final repair scopes will likely also address C-rated sidewalks within the general repair area to create functionally acceptable pedestrian routes. Where street level pedestrian walkways cross curbs, curb ramps will be provided ancillary to priority sidewalk rehabilitation projects. In addition, provision of curb ramps will also be coordinated with street alterations where the functionality of the pedestrian route is moderately improved. The quantity of ADA-compliant curb ramps provided annually will not be less than the total required for street alterations each year.
See Section 2.4.3 for time horizon, annual funding level, and barrier removal target.
Public Official Responsible for Plan Implementation
The City’s ADA Transition Plan for sidewalks in public right-of-way is implemented by the Director of Transportation and Public Works.
Opportunity for Individuals with Disabilities to Provide Input Multiple, ongoing opportunities to provide input include: the Mayor’s Committee for People with Disabilities, the City of Austin ADA Task Force, the Pedestrian Advisory Committee, 3-1-1, and ADAPT, a grassroots community of disability rights activists.
2.4.3. Funding
The anticipated average service life for sidewalks is approximately 75 years. As a result, replacement of the current 2,800-mile sidewalk network on a 75-year cycle (1/75th or 1.3 percent of the sidewalk network annually) would cost approximately $30 million annually. This simplified service life model identifies the order of magnitude necessary to achieve a more functional sidewalk network, providing a baseline for annual sidewalk repair and rehabilitation budgets.
Historically, deferred maintenance or future expansion of the sidewalk network is not included in the 75-year life cycle cost calculation. The estimated duration to repair or rehabilitate all functionally deficient existing sidewalk in the network at a $30 million annual budget exceeds 20 years. Therefore, this Plan includes a 10-year target to achieve acceptable functionality for 80% of all Very High and High priority sidewalks and 50% of the citywide sidewalk network. Below is the new sidewalk program target and key recommendations for existing sidewalks in Austin:

What we heard
“Many sidewalks are effected by tree roots. The roots cause buckling of the sidewalks. Also, restrict water flow into drainage structures. The maintenance of drainage structures can be slow, relative to the deformation damage, induced by vegetation propagation. This is an expensive problem to control.”
—Community member comment, Survey, August - September 2021 ”
Pedestrian Crossings
Pedestrian crossings are an important complement to sidewalks and shared streets. They address safety and comfort
for pedestrians at locations where different modes of travel intersect, where the risk of crashes or conflicts is highest. Together, sidewalks/shared streets and crossing improvements such as signals, crosswalks, bulb outs, or crossing islands form a cohesive pedestrian network.
The fundamental purpose of the 2023 Plan pertaining to pedestrian crossings is to evaluate whether each crossing in the city is suitable, identify gaps between suitable crossings, and prioritize corridors for build out.
This chapter begins with a snapshot of existing pedestrian crossings and pedestrian safety in the City of Austin, followed by an overview of the standards and funding sources for pedestrian crossing improvements. This chapter also includes the first citywide assessment of pedestrian crossings: a two-step process that identifies sections of corridors where the distance between suitable crossings exceeds city standards (see Section 3.2), as defined in the Transportation Criteria Manual and the City’s Crossing Guidelines. The chapter concludes with a framework for prioritizing crossing improvements and toolkit for implementation.
3.1. Background
The Transportation and Public Works Department leads a pedestrian crossing program, in coordination with various other mobility programs to achieve more complete street outcomes. The crossing improvement program is designed to enhance the pedestrian network in coordination with sidewalk investments and b) address racial and economic disparities in pedestrian safety.

Community input on crossing needs.
During the ATX Walk Bike Roll process, the public was given the opportunity to identify challenging crossing locations on an online map (promoted online and through the Community Ambassadors, who helped focus population individuals provide input). Participants identified 465 unique challenging crossings and placed dots on the map at those locations. In addition, 1,575 total upvotes and downvotes were received on those 465 challenging crossing dots. This community-generated data is used as an input to the crossing gap prioritization tool, described in Section 3.2 and Appendix I.
3.1.1. Pedestrian Safety at Crossings
The Austin Pedestrian Safety Action Plan evaluated pedestrian safety related to a variety of roadway factors. One of its key findings was that crashes that happen farther from signalized crossings (i.e., traffic signal or pedestrian hybrid beacon) are more severe. Crashes occurring over a half mile away from the nearest signalized crossing resulted in serious injury or fatality
43% of the time, compared with only 22% of the time if the crash occurred within one-eighth of a mile of a signal (See Figure 3-2), likely due to the faster speeds drivers can achieve farther from the intersection.1 This data underscores the importance of addressing driving speeds, multi-lane streets, and crossing gaps along entire corridors in service to pedestrian safety, not just at signalized intersections.

As part of ATX Walk Bike Roll, an analysis was performed to evaluate the relationship between the Pedestrian High Injury Network (HIN) and Equity Analysis Zones (EAZs). The Pedestrian HIN shown in Figure 3-3, which also shows the location of Focus EAZs, represents less than five percent of the non-freeway roadway network but nearly 70 percent of the pedestrian serious injury and fatal pedestrian crashes occur on it. The relationship between the Pedestrian HIN and EAZs was evaluated by calculating the percent of streets within each EAZ category that are designated as being on the Pedestrian HIN

Figure 3-4 shows the proportion of streets that are part of the Pedestrian HIN both citywide and within Focus EAZs. Areas with higher shares of the roadway network along the Pedestrian HIN typically overlap with Focus EAZs. This analysis highlights that lower income communities of color experience a disproportionate burden related to pedestrian safety compared to other communities in Austin. It also identifies an opportunity to address racial and income disparities by focusing pedestrian safety investments along the Pedestrian HIN.1 The Vision Zero program has performed additional analyses on the intersection of race and traffic safety; see the Vision Zero webpage for more information.
Pedestrian High Injury Network
The Pedestrian HIN is comprised of corridors with a relatively high number of pedestrian-involved crashes that result in serious injuries of fatalities.
Learn more at the City’s Vision Zero webpage.
3.1.2. Standards and Crossings Toolkit
In Austin, pedestrian crossing design is guided by the City of Austin Transportation Criteria Manual (TCM) and the City’s Crossing Guidelines. Section 4 of the TCM states that, “pedestrian crossings should be highly visible and be combined with street design treatments that slow vehicle speeds near the pedestrian crossings.” They shall be provided frequently to ensure safe pedestrian crossings, avoid crossing delay, discourage unsafe and illegal crossings, and promote walking as a chosen mode of transportation.”1 In addition, pedestrian crossings must be:
- designed to be as short as possible,
- highly visible to other users,
- ADA compliant using curb ramps and detectable warning surfaces, and
- signaled as appropriate or to meet City standards.
The City’s Crossing Guidelines2 are used to determine the appropriate crossing treatment for a location based on the number of lanes, whether there is a median island, vehicle speeds, and vehicle volumes. The toolkit on the following pages is based on those guidelines and provides a brief overview of what each element entails and the general cost of implementation.
What we heard
When asked to select their top five priorities for the City to do to help people walk/bike/roll more comfortably, 41% of survey respondents would like the city to build more designated pedestrian crossings (on average, this was the fourth-highest priority). At 49%, the level of support for additional pedestrian crossings is higher among the focus population respondents (this was the third-highest priority on average for the focus population respondents).
Several respondents voiced frustration about driver behaviors and long waits at traffic signals, making comments like this: “The lights are VERY long and do not provide lead time for cyclists and pedestrians in much of the city. This is especially difficult at unshaded intersections, where the heat can really bear down on you and cars are not attending to cyclists and pedestrians when they get going again.”
—Community member comment, October 2021

High Visibility Crossings improve a driver’s awareness of a pedestrian crossing through a striping design, which includes continental crosswalk markings. These enhancements are generally appropriate on all streets but higher speed streets require additional treatments to provide the needed level of safety.
The cost for these types of enhancements range from
$2,000 to $8,000.
Crossing Islands or pedestrian refuge islands provide a protected space for pedestrians to stand and wait in the middle of a two-way street. Crossing islands are generally appropriate on all street levels and should be considered with signalized treatments for level 3 and 4 streets1 with high travel speeds.
The cost for this treatment ranges from $30,000–$50,000 depending on design and field constraints.
Curb Extensions, or bulb outs, extend the sidewalk into the street to reduce the distance of the crossing, limiting the exposure of crossing pedestrians and enhancing the sight distance between pedestrians and motorists. Curb extensions are good candidates for locations with existing parking lanes and should be used in combination with other countermeasures. Curb extensions are generally appropriate on all street levels within the guidelines of the Transportation Criteria Manual.
The cost for this treatment ranges from $10,000–$50,000, depending on design and field constraints.
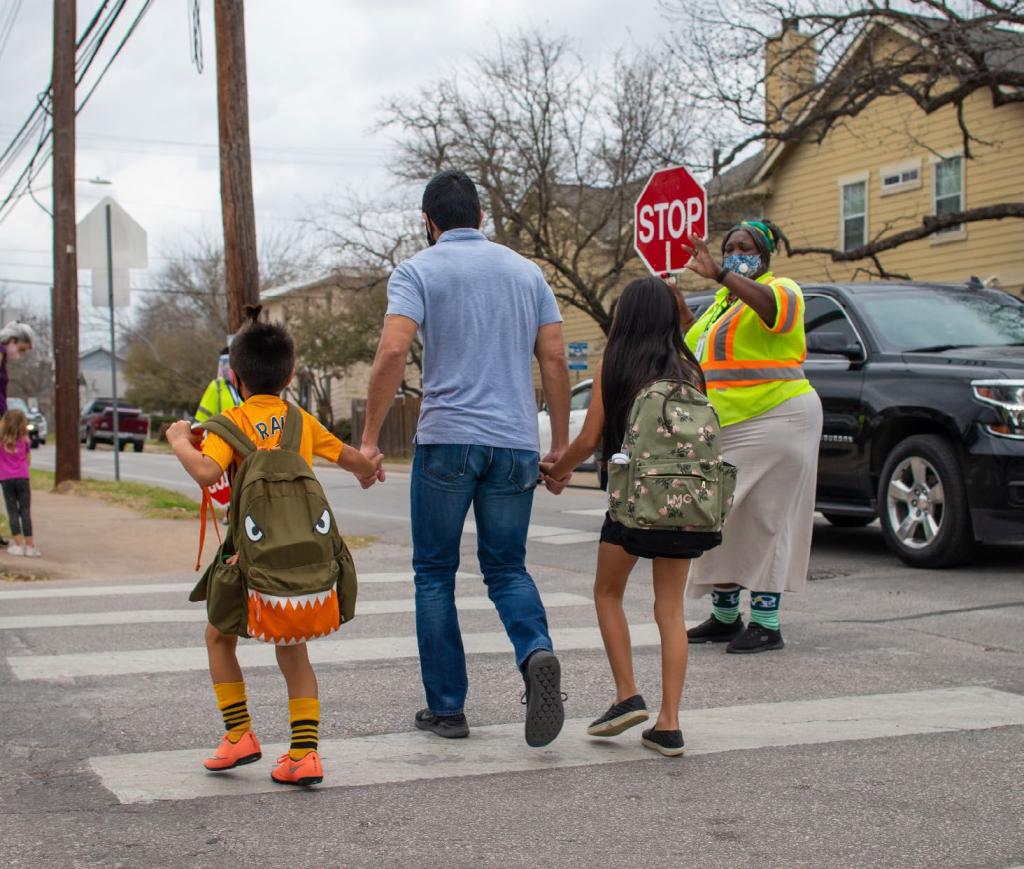
Raised Crossings are ramped speed tables spanning the entire width of the roadway, often placed at mid-block crossing locations. Raised crossings are particularly useful around schools where children are expected to cross frequently.
The cost for this treatment ranges from $30,000–$75,000, depending on design and field constraints.

Grade Separation refers to building a pedestrian bridge or tunnel to fully separate people crossing from moving vehicles using a multilane street or a controlled access highway. Grade separation can eliminate the conflicts associated with crossing such facilities. The cost for this treatment can range from $2 million–$20 million, depending on location and complexity.
Rectangular Rapid Flashing Beacons (RRFB) are rectangular-shaped yellow lights indicators that flash when a pedestrian activates it via pushbutton or pedestrian detection. These are typically used with a crossing warning sign and are placed on both ends of the crossing and potentially in the crossing island (if present). RRFBs are generally appropriate when crossing islands can’t be installed. The cost for this treatment ranges from $10,000–$30,000, depending on design and field constraints.
.Pedestrian Hybrid Beacons (PHB) include one yellow and two red lenses on a signal pole to stop traffic when pedestrians are present. The PHB are activated by a pedestrian push button or pedestrian detection. PHBs are generally appropriate on level 3 and 4 streets. The cost for this treatment ranges from $190,000-$230,000.
Other Signal Solutions
Countdown timers, Audible Pedestrian Signals (APS) and Leading Pedestrian Intervals (LPI) are among several solutions that support safer and more predictable crossings at signalized intersections. The costs for these treatments range from $1,000–$20,000, depending on treatment type.
Lane Conversions: a Tool for Establishing Safer and More Frequent Crossings
Streets with more than one lane in each direction tend to require signalized treatments to make crossings safer and more comfortable. This is in part because of the multiple threat crash risk where a driver in one lane yields to a person crossing the street but the driver in the other lane does not, elevating the risk of the person crossing the street to be struck. A signal controls for these movements and thus reduces the risk of conflict. However, signalized treatments such as full signals and pedestrian hybrid beacons (PHBs) are typically much more expensive to construct than unsignalized treatments such as pedestrian crossing islands, making it difficult to install signalized crossings on multilane streets at the frequency necessary to provide accessible, convenient, safe and comfortable crossings for use in accessing bus stops, schools, parks, corner stores and other destinations. Lane conversion is a tool that repurposes the outside general travel lane through the midblock of a multilane street to another use thereby reducing the number of travel lanes a pedestrian has to cross. This treatment can open up more cost-effective options for constructing frequent unsignalized crossings, typically in the form of a pedestrian crossing island, between major intersections that are typically left signalized to accommodate multiple turn and through lanes. By keeping the number of lanes at major intersections, a street can function as it does today for motor vehicles, while also opening up space between these intersections to enable safer crossings as well as other uses such as parking, floating bus stops, or bike lanes. Signals can cost between $500,000 and $1 million and PHBs can cost between $190,000 and $230,000. At between $20,000 and $50,000 for a pedestrian crossing island, one can construct 10-15x more crossings with a lane conversion versus signalized treatments. This treatment also makes the street safer for everyone. Austin’s use of this tool in converting streets from four to three lanes has shown a crash reduction of between 20 – 40% and significant reduction of high-risk speeding*, which is a primary cause for serious injury and fatal crashes in Austin. *Austin Transportation Lane Conversion Report, 2015.
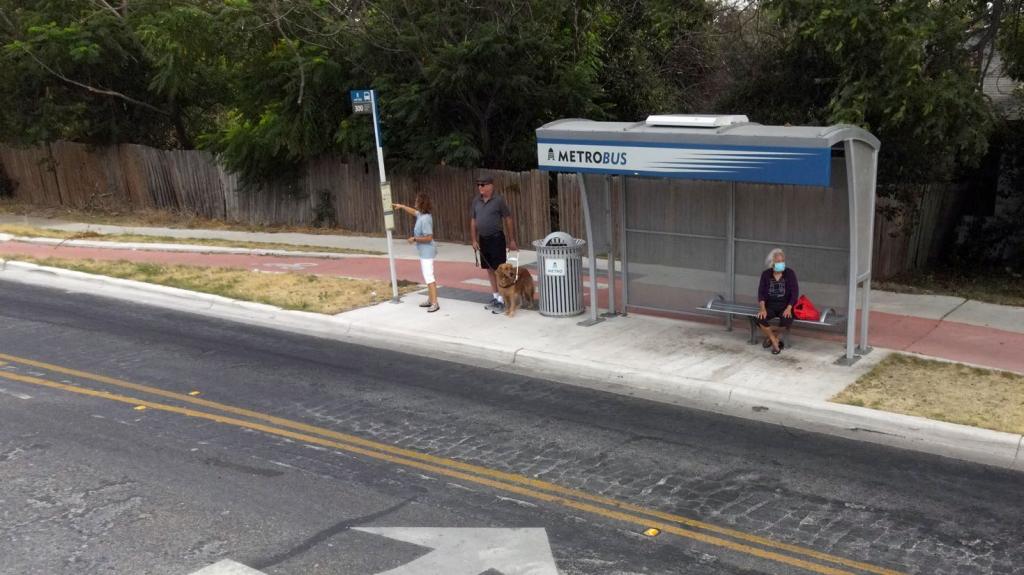
Floating Bus Stop
A floating bus stop is designed to remove the conflict between people walking, bicycling and getting on and off buses by bringing the bike lane and sidewalk behind the stop. This also makes it easier and more efficient for the bus operator to stop curbside for boarding and alighting. The costs for this treatment ranges from $30,000 to $50,000 per stop.

Centerline Hardening can be placed along the centerline (middle) of a roadway at intersections where there is not enough roadway width for a median or crossing island. Hardened centerlines slow left-turning traffic and can be constructed of concrete curbing, rubber blocks, rigid or flexible posts, or a combination of these. The cost for these types of enhancements range from $2,000–$100,000, depending on length and material.
Turn Wedges are placed at the corner and extend toward the center of an intersection. Providing a similar traffic calming effect as curb extensions, turn wedges slow right-turning traffic. Turn wedges can be constructed of concrete and raised above the roadway surface, they can include rigid posts/bollards, or they can be more rapidly installed with paint and flexible posts.
The cost for these types of enhancements range from
$2,000–$5,000.
Pedestrian Scale Lighting provides an appropriate level of lighting at an established crossing during night or low-light conditions. These enhancements are generally appropriate on all streets but higher speed streets require additional treatments to provide the needed level of safety.
The cost for these types of enhancements range from $5,000 single luminare, $20,000–50,000
full intersection.
Daylighting improves visibility at intersections and mid-block crossing locations by removing visual obstructions in close proximity to the crossing. Daylighting can include the spot removal of parking space markings generally with signs. These enhancements are generally appropriate on all streets and most useful at cross streets.
The cost for these types of enhancements range from $2,000–$30,000, depending on material, design and field constraints
 3.2. Identifying and Addressing Crossing Gaps
The Transportation and Public Works Department will use this Plan to identify general locations where crossing enhancements are needed and then use further analysis and judgment to identify specific locations and treatments to address the gaps. Again, the focus for this effort is on crossings that are currently non-signalized.
Identifying corridor segments where there are insufficient crossing opportunities is a two-part process. First, data are used to evaluate whether the treatments present at an existing pedestrian crossing are suitable for the context. Once suitability has been determined, the distances between suitable crossings can be measured to identify gaps. Crossing gaps are then quantified and prioritized to form a build-out plan for pedestrian crossings that identifies the necessary funding level to achieve the target of eliminating 50% of Very High and High priority crossing gaps within Focus EAZs, along the Pedestrian High Injury Network (HIN), or within a 1/4 mile of all identified schools, public transit stops and stations, and parks by 2033.
3.2.1. Crossing Suitability Evaluation
The presence of a marked crosswalk at a pedestrian crossing does not fully convey the condition, quality, or suitability of that crossing. To evaluate the suitability of every pedestrian crossing in Austin, the City developed an inventory of all existing and potential crossings and systematically evaluated each (see Appendix I for the full methodology). Potential crossings were identified on all sides of all street intersections without existing marked crossings. Existing crossings were identified at intersections and mid-block locations where the City has installed crossing treatments like marked crosswalks, pedestrian crossing warning signs, or median islands.
The suitability evaluation method considers basic details including the speed of cross traffic, distance to cross, and mitigating features like signals and crossing island. Suitable crossings are those on lower-traffic/lower-speed streets as well as crossings with appropriate treatments to mitigate higher speeds and traffic volumes. Unsuitable crossings are those that are more stressful, and often include locations with multiple lanes, high traffic volumes, and high speeds. A detailed methodology of the factors used in these calculations is available in Appendix I.
 To further limit the number of potential crossing gaps along Austin’s roadways, the following “rules” were also applied:
- Due to the low-speed (typically 30 MPH or less), low-volume (typically less than 1,000 vehicles per day) characteristics of a Level 1 street, all crossings of Level 1 streets are considered suitable for the purposes of this exercise.
- Any signalized intersection was considered suitable.
Every existing and potential crossing within the City of Austin was rated using the methodology. Figure 3-6 summarizes the percentage of crossings suitable for the surrounding context citywide and in Focus EAZs. The Focus EAZs have a lower percentage of suitable crossings.
3.2.2. Distance Between Suitable Crossings
After calculating a suitability score for every crossing, the next step was to measure the distance between suitable crossings and flag locations where the distance between suitable crossings exceeds the distances specified in the Transportation Criteria Manual (TCM). As shown in Figure 3-7, the required crossing spacing varies by street level2 and whether a street is part of the Transit Priority Network.
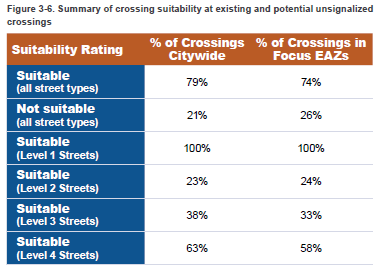

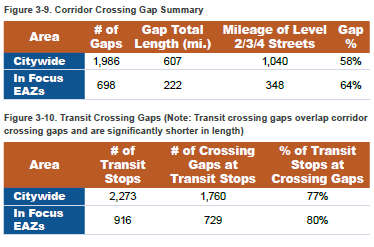 3.2.3. Crossing Gap Identification
Completing steps one and two above reveal that many corridors in Austin have significant crossing gaps that present pedestrians with the difficult choice of traveling out of their way to reach a suitable crossing or putting themselves at risk crossing the street at an unsuitable location. Figure 3-8 is a map that highlights the segments of corridors with crossing gaps. Many of the longest gaps are outside of the center of Austin where development patterns are less dense and the distances between intersections are greater.
Figure 3-9 summarizes the number of corridor gaps and compares the number of gaps in the Focus EAZs with the citywide total. The number of crossing gaps in EAZs is higher than the City as a whole, potentially reflecting lower levels of infrastructure investment and auto-centric development patterns that put pedestrians at risk.
Figure 3-10 summarizes the presence of transit crossing gaps (lack of suitable crossings within 100 feet of transit stops). This shows similar levels of disparities in gap presence within Focus EAZs.
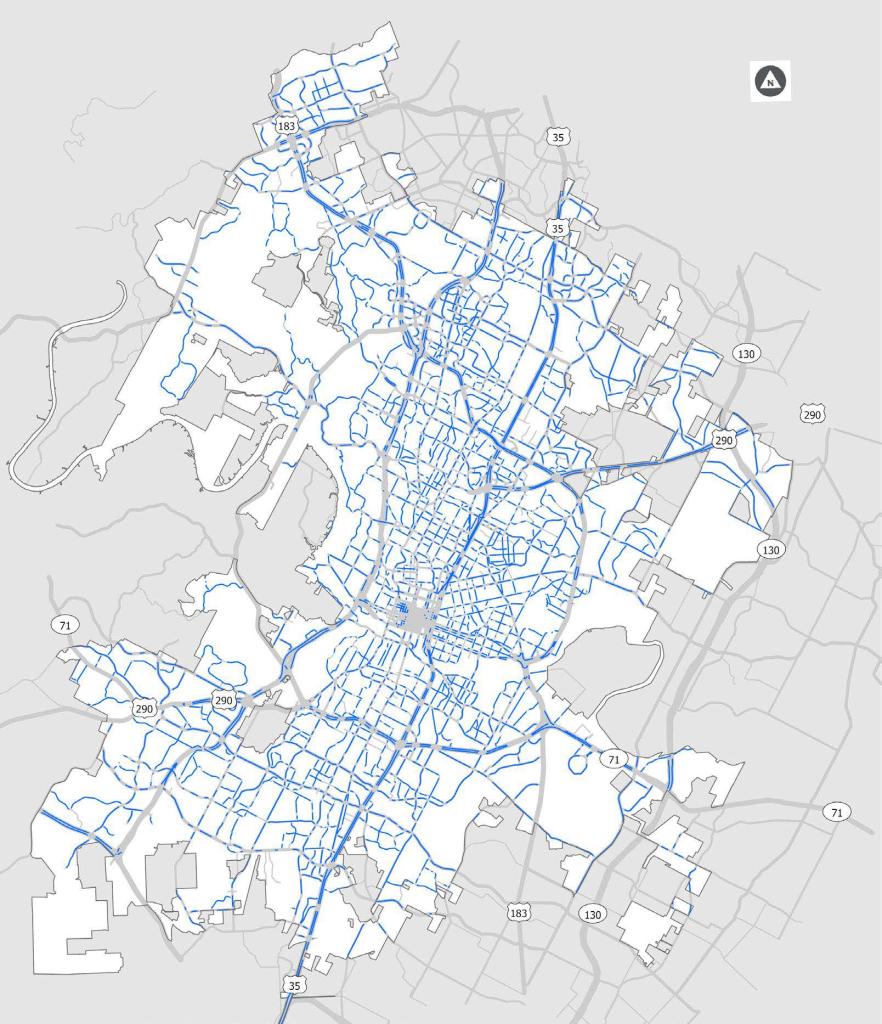
3.2.4. Crossing Gap Prioritization & Project Selection
A crossing gap prioritization model was developed to guide the selection of the most important gaps to address (see Figure 3-11). This model was designed to have alignment with the sidewalk and shared streets prioritization model but to incorporate the unique factors that influence safety at crossings. Community priorities for crossing improvements were identified during public engagement to verify and adjust the model. To be consistent with the ATX Walk Bike Roll Equity Framework, equity is the highest weighted factor at 30 percent.What we heard about prioritizing crossings
When asked to where safe crossings were needed most, community members scored the following location types from 1 to 5, with 1 being least important and 5 being most important.
What we heard about prioritizing crossings
When asked to where safe crossings were needed most, community members scored the following location types from 1 to 5, with 1 being least important and 5 being most important.
- Streets with a history of serious or fatal pedestrian crashes topped the list with an average score of 4.7.
- Near K-12 schools ranked second with an average score of 4.5
- Near transit/bus stops and on busy streets with many cars or cars moving quickly tied for third with average scores of 4.3.
- Improved connections across major barriers such as highways, railroads and creeks received a 4.2
- Near neighborhood commercial districts rounded out the list with an average score of 3.9.

Crossing gaps on Level 2, 3, and 4 streets were prioritized during the development of this plan. Gaps along frontage roads were not included in this analysis because the solutions to those gaps (typically bridges or underpasses) are significantly different than crossing treatments for surface streets. Figure 3-12 is a map of prioritized crossing gaps where darker colored lines indicate higher priority. There are clusters of high priority crossing gaps in East Austin and along many of the major corridors in the northern and southern parts of the city.

Figure 3-13 summarizes crossing gaps by priority and ASMP Street Level.4 The majority of Very High and High priority crossing gaps are on Level 4 streets, which will need more expensive and substantial treatments to improve safety. Very High and High priority crossing gaps on Level 2 and some Level 3 streets can be addressed with less expensive treatments. Moving forward, the City will need to identify the right balance between making a few substantial investments on the busiest streets and making more widespread interventions on calmer roadways.
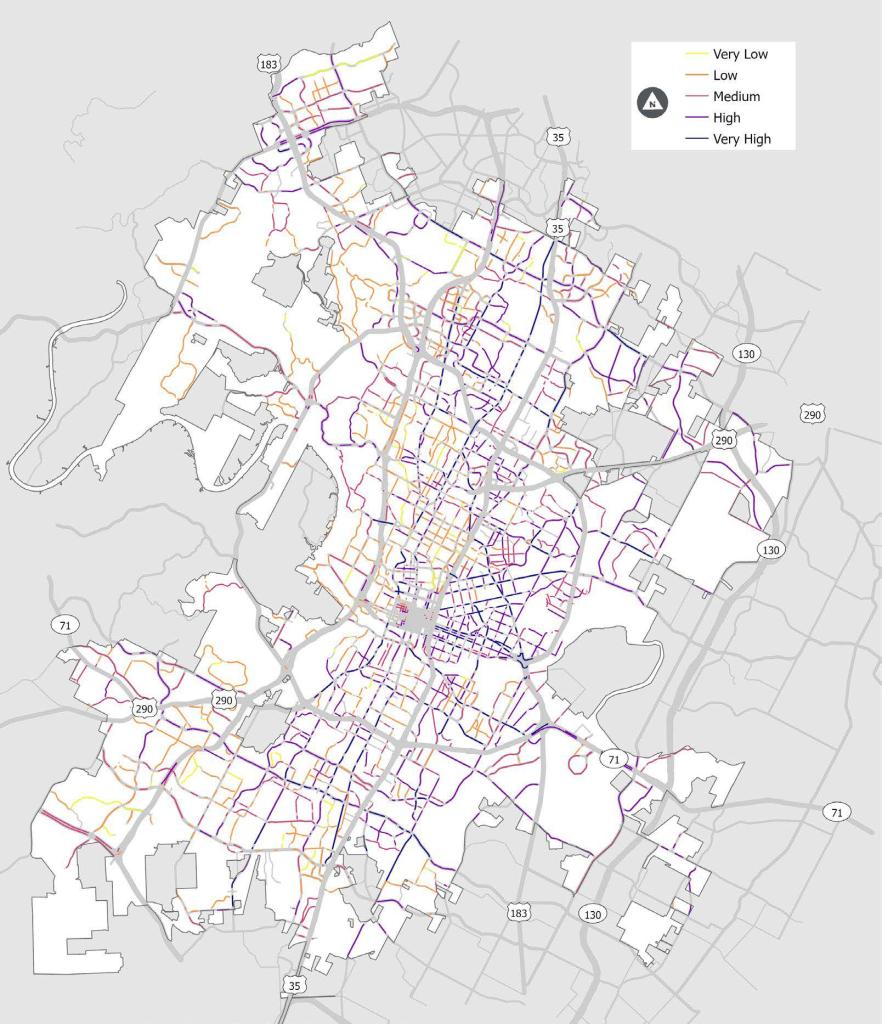
Figure 3-14 summarizes what portion of the gaps citywide and within Focus EAZs are prioritized by this plan.

Project Selection
Project selection will begin with the Very High and High priority crossing gaps and will be leveraged with other projects to build crossings that address crossing gaps. Examples include:
Imagine Austin Centers and Corridors
- Other City projects, such as street maintenance, utility improvements, and facility access improvements
- 311 and ADA access requests
- Bicycle program and Urban Trails program projects
- Transit projects, such as improvements with new or relocated CapMetro stops, with particular priority for high volume transit locations, special use routes, or CapMetro Para transit priority locations
- Safe Routes to School Program
- Opportunities to leverage funding
- Records of automobile/pedestrian incidents
- Speed Management Program
3.2.5. Pedestrian Crossings Network Plan
There are 1,986 crossing gaps in Austin totaling 607 miles in length. The approach to (and cost of) addressing these gaps varies based on context and street level. The specific location, design, and selection of crossing treatments will vary from location to location and be based on the ATD Crossing Guidelines5 and engineering judgement. The information below is presented to forecast the order of magnitude of building out the pedestrian crossing network.

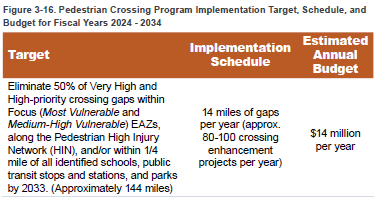 3.2.6. Funding
Pedestrian crossing improvements are implemented through a variety of funding programs, including but not limited to major capital improvements projects, the Corridor Program, and Safe Routes to School. The 2018 and 2020 Mobility Bonds also provide funding for crossing improvements as part of larger safety/Vision Zero funding categories.
- The 2018 Bond includes $15 million for intersection and pedestrian safety improvements, with $4 million of that set aside for the Pedestrian Crossing Program.
- The 2020 Bond has $65 million for projects that reduce conflicts and improve safety for all road users through major roadway reconstruction and rapid implementation of low cost, high-impact projects, with $4.1million specifically for the Pedestrian Crossing Program.
The total cost of addressing all crossing gaps far exceeds these limited funds. To address and eliminate the highest priority crossing gaps by 2033, additional funding will be needed. Below is the new crossing program target and key recommendations for addressing crossing gaps in Austin.
CHAPTER 4 | IMPLEMENTING THE PLAN
This section identifies the strategies and action items that provide direction for achieving the City’s goals for sidewalks, shared streets, and crossings. The strategies and action items include those identified during the process of developing this 2023 Plan, as well as recommendations from the 2016 Sidewalk Plan and 2018 Pedestrian Safety Action Plan that have not been completed or are in the process of being completed. On the following pages, seven key strategies are identified and defined. For each strategy, a collection of action items is listed with timeframes.
4.1. Implementation Responsibilities 
The main components of this plan—sidewalks, shared streets, and pedestrian crossings— work in concert. At the time this Plan was first drafted, these components fell under two different departments. By the time of adoption, the two departments had been combined and implementation of the Plan will be the primary responsibility of the Transportation and Public Works Department. Ongoing coordination amongst the department’s programs as well as other Departments citywide will be vital to realize the goals of this plan.
Mobility Annual Plan
The challenges of transforming and then maintaining a citywide sidewalk, crossing, and shared streets network requires a robust multi-programmatic and interdepartmental approach. The Sidewalk Program and Crossings Program provide technical support and coordination resources to the many other city programs that also work directly on pedestrian infrastructure. One of the primary coordination mechanisms is the Mobility Annual Plan, which aligns planned improvements by a variety of programs and agencies, including Sidewalks, Crossings, Vision Zero, the Corridor Mobility Program, Regional Mobility Program, Major Capital Improvements, Safe Routes to School, Urban Trails, Bikeways, Transit Enhancement, Neighborhood Partnering Program, Street Reconstruction, Substandard Streets / Capital Renewal, Project Connect, and Capital Metro.

| STRATEGY 1 | Prioritize equity in the completion and maintenance.
Prioritize equity in the completion and maintenance of the pedestrian network by:
- allocating more resources in areas of historical inequity and ongoing vulnerability; and
- providing stable and sufficient funding through Transportation User Fee and/or other non-bond sources for sustainable repair and rehabilitation.
To enhance equity, capital and maintenance investments in pedestrian facilities are to be focused in areas that have higher concentrations of populations that have been historically marginalized. The Sidewalks, Crossings, and Shared Streets Plan uses Equity Analysis Zones (EAZs), which identify areas that include higher concentrations of historically marginalized populations and have more barriers to achieving equitable outcomes, to assess equity.

| STRATEGY 2 | Provide safe, comfortable, and accessible pedestrian passage along and across every public street.
Pedestrian safety is defined as designing and operating streets in ways that reduce crashes between people walking and motor vehicle traffic. Pedestrian comfort includes enhancing the experience of walking through things like shade, art, and routes that are as direct and flat as possible. Comfort also includes addressing the perception of safety such as providing crossings that are short and low-stress, additional separation between sidewalks and motor vehicle traffic, and pedestrian lighting. Austin aspires to have a sidewalk and shared street network that connects the entire city and provides access to every property. There are existing gaps and missing links in the network. Installing sidewalks or shared streets to fill in the missing links is vital to provide pedestrian access for everyone and every destination throughout the entire city.

What we heard about shade and lighting
Ambassador engagements and focus group discussion participants frequently reported a lack of shade and a lack of lighting along the right-of-way to support a comfortable walking,
biking, and/or rolling experience. 28% of survey respondents chose this as a top concern. Almost 90% of respondents (92% of focus population respondents) strongly or somewhat support the statement “active transportation routes, such as sidewalks, bikeways, urban trails, and pedestrian crossings, should have comparable lighting to roads and highways” and almost 80% of respondents (81% of focus population respondents) “support increasing the operations and maintenance budget” for the city to install more trees, water fountains, and benches in the public right-of-way.“Heat island effect is a real barrier, especially as climate change ramps up. Shade is critical in addition to the actual safety of pedestrians and bike, etc. Include in plans tree plantings wherever possible along any sidewalk, trail, and bus stop.”
—Community member comment, October 2021

STRATEGY 3 | Collaborate with public and private partners using a Complete Streets approach to improving the pedestrian network.
There are many potential partners in delivering on policies and goals, such as school districts, non-profits, community-based organizations, businesses and other
private organizations, regional planning agencies, and the state agencies. Many partner agencies will realize benefits from expanded and enhanced pedestrian
facilities. Partner agency resources can be used to enhance the City’s resources, providing not only funding, but a more comprehensive approach to pedestrian
enhancements.
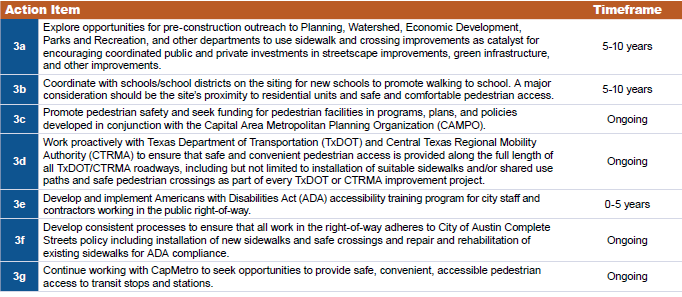
STRATEGY 4 | Improve efforts to assess the pedestrian network, and evaluate and communicate progress made toward achieving a safe and accessible pedestrian network.
It is vital to understand how pedestrian investments impact safety and accessibility of the pedestrian network and move the community toward achieving its goals. Regular and routine data collection, evaluation, and reporting will help determine if efforts are leading to the desired outcomes and where changes in approach are needed.

STRATEGY 5 | Improve the condition of sidewalks and shared streets.
Investments in the sidewalk and shared street network are only useful if they are in acceptable condition and properly maintained. Having pavement and tree limbs obstructing pedestrian routes are just a few examples that make pedestrian travel difficult, especially for people with disabilities. It is important that there is a collective understanding of who is responsible for maintenance and that routine maintenance, repair, and rehabilitation is performed to provide a safe, functional, comfortable, and accessible pedestrian network.

STRATEGY 6 | Reduce the distance between low-stress crossings.
Streets, especially those with high motor vehicle volumes and speeds, create barriers to pedestrian travel. The distance between low-stress crossings along streets impacts the functionality of the pedestrian network. Large gaps between low-stress crossings can cause pedestrians to cross at unsafe locations. The City of Austin Transportation Criteria Manual states that crossings should be provided at frequent intervals to ensure safe pedestrian crossings, avoid crossing delay, discourage unsafe and illegal crossings, and promote walking as a chosen mode of transportation. It also provides maximum desirable spacing between marked crossings.

STRATEGY 7 | Enhance the safety and accessibility of existing crossings.
Barriers can limit the accessibility of existing pedestrian crossings, especially for individuals with disabilities. Removing barriers to accessibility, such as installing ADA-compliant curb ramps, providing smooth and level crossing surfaces, and regularly removing debris can enhance crossings and the functionality of the entire pedestrian network.

ADA Transition Plan for Crossings
The Americans with Disabilities Act (ADA), signed in 1990, mandates in Title II, Subpart A, that public entities establish and maintain a Transition Plan to achieve full accessibility of existing public infrastructure, including pedestrian crossings within public right-of-way.
While City staff have considered and incorporated accessibility into crossing designs, a full inventory and plan for transition is warranted. A transition plan is a step toward a more accessible and equitable pedestrian network. According to federal law, ADA transition plans require:
- Inventory of physical barriers and proposed methods to remove them
- Schedule for barrier removal
- Public official responsible for plan implementation
- Proposed funding source for improvements
- Opportunity for individuals with disabilities to provide input
