![]()
Large-Scale Engineering Projects
Austin Transportation is working to create a transportation network that protects human life, even when individual users make mistakes; in other words, we are designing our network with safety as the primary consideration. Engineering and street design are therefore key strategic elements of a successful Vision Zero program. Find out more about some of our engineering projects improving safety, below:
-
A full list of bond-funded Vision Zero Intersection Safety projects can be found on the Mobility Bond webpage.
-
Austin Transportation’s Active Transportation and Street Design Division creates safe multimodal mobility options throughout Austin.
-
Our partners at Public Works have various programs which enhance bicycle and pedestrian safety through urban trails, new and reconstructed sidewalks, the Neighborhood Partnering Program, and Safe Routes to School.
Systemic Safety Initiatives
The City of Austin’s Vision Zero efforts follow a Safe System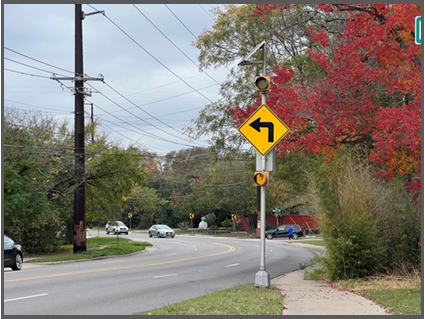 approach: to design and operate our transportation network in a way that anticipates human errors, accommodates human injury tolerance, and has the ultimate goal of reducing fatal and serious injuries on our roadways. Per the Austin Strategic Mobility Plan, one key principle of Austin’s Vision Zero program is that “safety initiatives should proactively improve systems safety.” A proactive approach recognizes that there are certain similar conditions across our built environment that need to be addressed whether or not a severe crash has happened at that location in the past.
 The Vision Zero team identified multiple sets of systemic safety projects, or collections of similar locations that could be suitable for the application of a set of countermeasures, as part of a recently completed analysis of five years of severe crash data and common roadway conditions. The systemic safety countermeasures identified in the report are prioritized by expected benefit compared to cost. In addition, locations within each systemic safety countermeasure set were further evaluated with detailed engineering assessments.
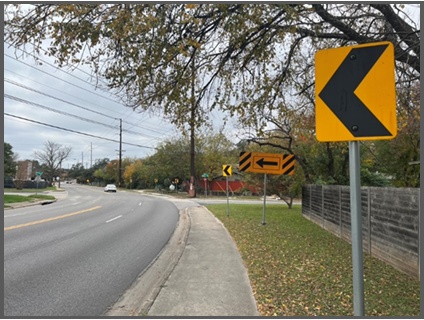
The first set of systemic improvements planned is curve improvements to address crashes with one motor vehicle involved, which happen frequently at roadway curves and is one of the most frequent severe crash types in the past five years. The team established a methodology for selecting curve improvement locations, including crash frequency, comprehensive crash cost, curve radius, speed limit, crash types, and root-cause evaluation. Treatments for each location were developed with the application of MUTCD (Manual on Uniform Traffic Control Devices) and AASHTO (American Association of State Highway and Transportation Officials) recommendations, supplemental warning systems, and engineering review. The team will apply a wide array of treatments depending on site needs, including chevrons, warning signs, flashing beacons, LED devices, raised pavement markings, striping, rumble strips, and advisory speeds. The design improvements are expected to be constructed in Winter/Spring 2022 at over 40 locations throughout Austin.
- Substantially Complete Improvements
-
- City Parks Road
- Four Points Drive
- Ladera Norte
- Cooper Lane
- Marcus Abrams Boulevard
- South 1st Street
- West Gate Boulevard
- Loyola Lane
- Manor Road
- Techni Center Drive
- East Riverside Drive
- West 6th Street
- Taylor Draper Lane
- Duval Road
- Metric Boulevard
- Sheridan Avenue
- Cameron Road
- Wasson Road
- Southwest Parkway
- In-Progress Improvements
-
- East Stassney Lane
- Parker Lane
- Azie Morton Road
- Burton Drive
- Oltorf Street
- Montopolis Drive
- Mount Bonnell Road
- Winsted Lane
- Metropolis Drive
High-Injury Roadways
Austin Transportation's Vision Zero program developed a High-Injury Network (HIN) which identifies streets in Austin with a relatively high number of serious injury and fatal crashes. From this network, the Vision Zero program identified 13 High-Injury Roadway sections to receive effective, low-cost safety improvements. The most recent five complete years of crash data was analyzed to identify top locations for focused engineering design initiatives, improved signage, and targeted enforcement on key dangerous driving behaviors. For more information, visit the High-Injury Roadways page.
2018 Bond Prioritization Methodology
Austin Transportation developed a new project prioritization methodology to ensure 2018 Bond Vision Zero funds are used most effectively. The two-step screening process generated a ranked list of projects for crash reduction and mitigation projects with available funding.
*Data caveats: The data used was primarily from the TxDOT Crash Records Information System (CRIS). The Vision Zero team did verify all fatal and serious injury crash locations for the five-year period analyzed, however many other crashes were incorrectly geocoded and the data set will be continuously updated for this and future analysis. In addition, the new geospatial analysis will be continuously enhanced as the initial round may include incorrect boundaries for particular streets, particularly freeways and access roads, based on the base maps provided for the analysis.
For more details on Steps 1 and 2 of the Vision Zero Prioritization Workflow, expand the buttons below.
- Step 1: Crash Frequency and Severity Rank (CFR)
-
The Vision Zero team segmented the Austin street network (Austin Strategic Mobility Plan Levels 3 and 4) into smaller units to aid with the analysis of crashes for a five-year period between 2015 and 2019, resulting in over 22,000 intersection polygons citywide. Each intersection polygon covered approximately 250 feet in length on each intersection approach to make the intersection polygon areas as uniform as possible. Using these defined locations, crashes over the five-year period were extracted using historical crash data using Texas Department of Transportation’s (TxDOT’s) CRIS and Austin Police Department (APD) databases.
The Vision Zero program developed a crash unit cost for different severity outcomes using guidance from USDOT, FHWA, and the National Safety Council, making adjustments using local data and policies. This provided a comprehensive crash cost for each location, and a corresponding Crash Frequency Rank for each location. The comprehensive crash cost for each severity category is as follows:
Injury Severity
(K,A,B,C,O)Comprehensive Cost Killed (K) $2,829,000 Suspected Serious Injury (A) $2,315,000 Non-incapacitating Injury (B) $233,000 Possible Injury (C) $233,000 Not Injured (O) $51,000 Unknown Injury (O) $51,000 Non-CR3 Records (O) $51,000 The top 100 highest-ranking comprehensive cost locations were selected. In addition, the team included 24 additional locations which had four or more fatalities or suspected serious injuries in the same time frame. These 124 polygons advanced to Step 2 for the determination of their Safety Analysis Index (SAI) scores.
- Step 2: Safety Analysis Index (SAI)
-
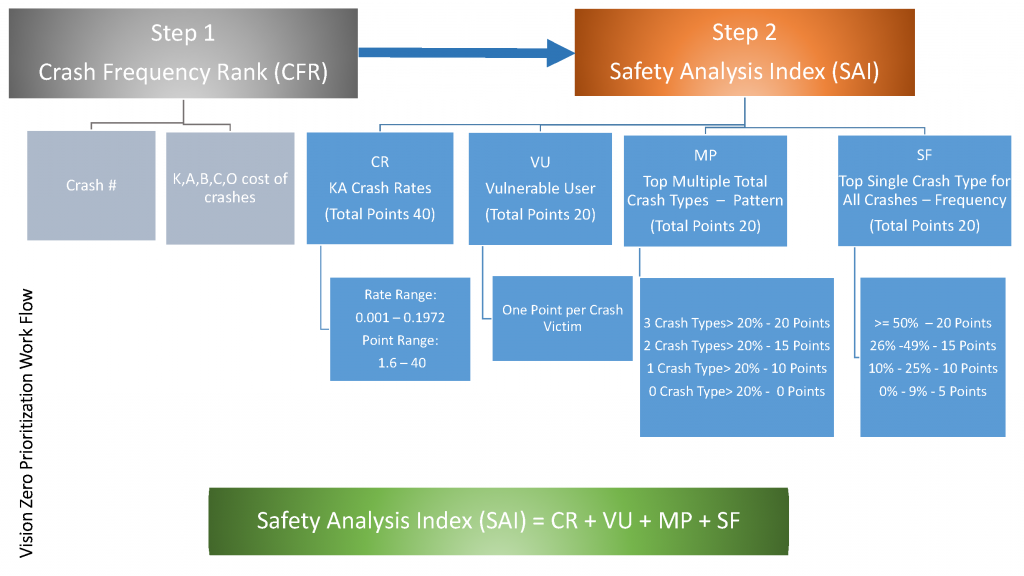
In Step 2, engineering criteria with weighting were applied to the highest-ranked 124 locations from Step 1. The purpose of this step was to arrive at a ranked list of locations with SAI scores using the criteria defined below.
The SAI score for each polygon is the sum of Crash Rate (score) + Vulnerable User (score) + Top Multiple Crash Types by Pattern + Top Single Crash Type by Frequency.
(SAI = CR + VU + MP + SF)
Crash Rate (CR) Score was calculated using total “K” and “A” crashes at each polygon, entering vehicle volumes over a five-year period, and indexed to a maximum score of 40 points. Vulnerable User (VU) Score was calculated by assigning 1 point to each victim for a crash involving a bicycle or pedestrian. Top Multiple Crash Types by Pattern (MP) was calculated with points and allocated as:
- 3 Crash Types > 20% = 20 Points
- 2 Crash Types > 20% = 15 Points
- 1 Crash Type > 20% = 10 Points
- 0 Crash Type > 20% = 0 Points
Top Single Crash Type by Frequency (SF) was calculated with points and allocated as:
- Greater than 50% = 20 Points
- 49% - 26% = 15 Points
- 25% - 10% = 10 Points
- 9% - 0% = 5 Points
The prioritized list of 66 locations will be utilized to implement critical safety treatments to achieve the desired Vision Zero outcome of reducing/eliminating serious injury and fatal crashes. The engineering team will use crash diagrams for each selected location, perform field safety audits, and recommend treatments that address the most critical safety needs while looking for additional enhancements to the urban environment by leveraging other funds across other capital programs, if available.
Interim treatments using low-cost solutions may be considered for each location to achieve safer outcomes in an expedited manner. As part of the scoping and engineering treatment selection, a benefit/cost ratio for each countermeasure may be calculated using federal and state-level crash modification factors (CMFs) where available to aid with the decision-making process so as to stretch program dollars to deliver safety improvements to the maximum number of locations. Austin-specific CMFs from previously completed projects, if applicable will be considered.
SAI scores for all 124 polygons were calculated and the scores were sorted in descending order to arrive at a ranked list of locations. Using natural breakpoints in the calculated SAI, a score below 38 was discarded. This resulted in 57 locations that were screened in Step 2.
In addition, another nine locations were added back to the list. These locations had a SAI lower than 38, however, they had either a total of KA crashes of five or more, or a total of bicycle or pedestrian crashes of four or more, or met both conditions. This resulted in a final Step 2 screened list covering 66 locations.
Transportation Safety Improvement Program
The Transportation Safety Improvement Program is housed within Transportation Engineering Division and plays a lead role in the oversight, analysis and delivery of critical engineering safety improvements and implementation of Vision Zero’s engineering action plan.
The Transportation Safety Improvement Program provides a comprehensive and coordinated approach to making Austin’s streets safer for all road users. The primary responsibilities include:
- Analyzing crash patterns and "hot spots" to develop and maintain the top-crash location list
- Conducting safety studies and preliminary engineering studies at locations where safety is a concern
- Leading design, construction and project delivery for safety improvement projects that enhance safety for all road users
- Delivering low-cost, high-impact safety improvements as appropriate
- Leading the implementation of Vision Zero’s Engineering Action Plan, working closely with the City's Vision Zero Program to deliver real-life, tangible safety and mobility benefits in a cost-effective and environmentally responsible way.
- Leading the City of Austin’s Fatality Review Board as the Board Chair to provide engineering oversight of fatality reviews and coordination with the Austin Police Department and other partner agencies
Conduct speed studies and formulate speed zone recommendations, as appropriate
Speed Management Program
Speeding is the primary contributing factor in one-quarter of Austin traffic fatality crashes. Each year more than 10,000 people lose their lives to speed-related crashes in the United States. In Austin, data shows speeding was the primary contributing factor in 24% of traffic crashes resulting in death between 2013-2017. This makes it the top one of the four behaviors which contribute to most of the fatal crashes in Austin (along with failure to yield, distraction, and intoxication).
Effective speed management is critical for creating streets that support safe and convenient travel by everyone—whether they are in cars, on bicycles, walking or using assisted mobility devices. People get around Austin in different ways (sometimes on the same trip); by implementing intuitive, context-sensitive speed management strategies, the Austin community can enable safe and convenient travel for all.
Visit ATD's Speed Management Program page for more information on efforts to reduce egregious speeding on all street levels and the likelihood of serious injury and fatal crashes.
Vision Zero Equity Storymap
Over 2,400 people in Austin were seriously injured or killed in traffic crashes over the past five years, 55% of which were people of color. Austin Transportation has released a Vision Zero Storymap to highlight the racial disparities in traffic crashes and injuries in Austin, provide context for the historical context and institutional factors that have contributed to and perpetuated these disparities, and, describe some of the ways how the Vision Zero program will seek to advance racial equity it its transportation safety work.
View the Safe for All Storymap. (Seguro para Todos)
Get Home Safe
Driving while under the influence of alcohol is one of the four primary causes of crashes with fatalities and serious injuries in our City. Austin Transportation’s Get Home Safe resources provide everyone with safe ways to get home after a fun night.