Texas State Students Dig into USGS Data, Mapping Austin's Hot and Cool Places
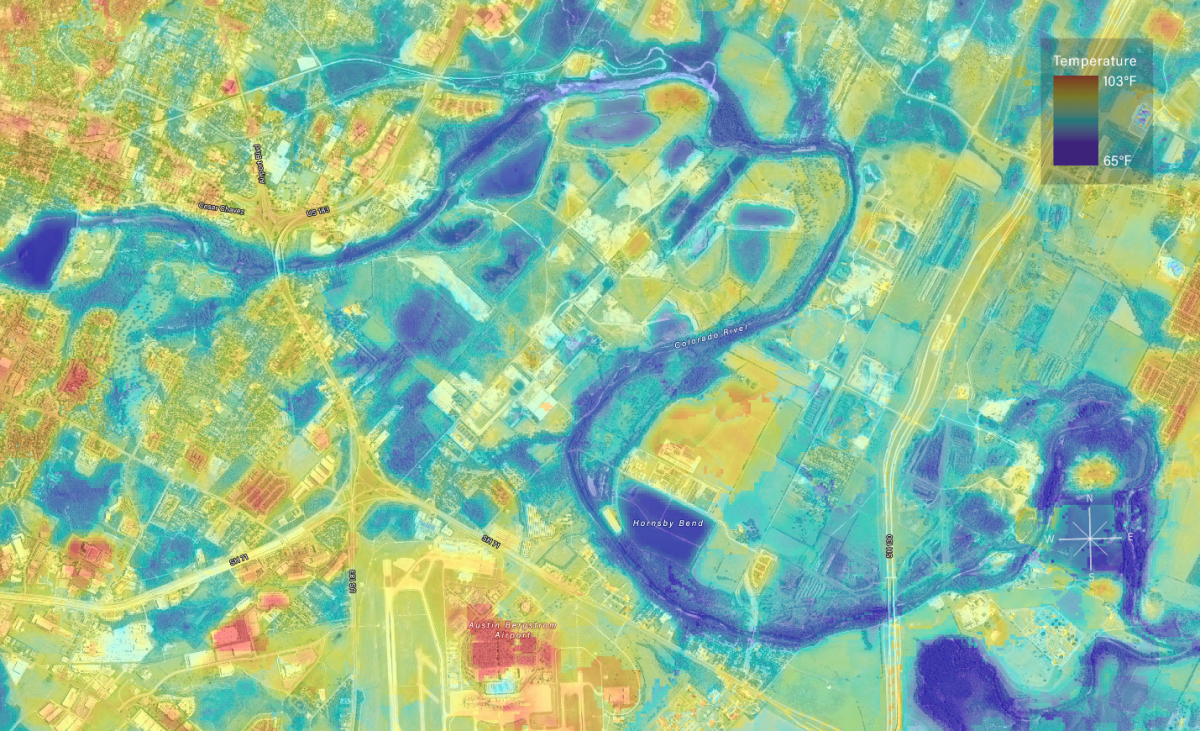
We’re nearing another Texas summer in Austin and it’s getting easier to imagine the record-breaking 110-degree weather recorded last July. Fascinated by the role that the landscape plays in urban heat and microclimates, students at Texas State University analyzed land surface temperatures across Austin. While this is something anyone can ‘feel’ when they step out in a black t-shirt, it’s interesting to take a step back and view the cityscape and urban heat on a larger scale. Students processed data provided by USGS and NASA, utilizing ArcGIS online to analyze and present their findings.
A Wealth of Data
- Satellites from the U.S. Geological Survey take pictures of Austin every 16 days—a program that’s been running since the 1970's. What a massive image library! With such a large library and a reputable track record, we can analyze any time in modern history.
- The satellite's camera senses heat across land without gaps. This means we can measure local climate everywhere not just at weather stations.
- Temperatures can be averaged for a specific place with images from many time periods. That's exactly what Texas State students did. They averaged seven Landsat satellite images, mapping the hot and cold spots.
What’s hot and what’s not? Trees and water help to cool our surroundings.
Students found average temperatures ranging from 69° F to 103° F from April through September. They found places with trees and creeks had much cooler recorded temperatures. On the other end of the spectrum, students found high heat corresponded to low tree canopy areas, high building density and pavement. Parks were almost always cooler than schools, offices, streets, and parking lots.
Mapped: Land surface temperature along the Colorado River in east Austin
The importance? We know heat imposes risks involving public health, tree health, and urban ecology. By understanding high heat areas, we can identify places to cool our surroundings by planting trees, adding parkland, and ultimately becoming more climate resilient. What's next? We'll continue to track heat as we repeat this process for other years.
Explore the data for yourself with this online map.
Learn about 6 strategies you can use to cool your space at the Cool Spaces webpage or get a printable PDF here.
Article contributed by Alan Halter, GIS Analyst Senior with the Community Tree Preservation Division. Questions?


