
Demographics
In addition to conducting an analysis of sentiment and a deeper analysis of survey trends, OPO analyzed respondents’ demographic data.
All survey respondents were able to self-identify as to the following:
- Race/ethnicity;
- Language(s) spoken at home;
- Gender identity;
- LGBTQIA+ identity;
- Age;
- Social class;
- Physical and mental health conditions;
- Residential ZIP code; and
- Employment ZIP code.
Demographic categories and terms were constructed after researching survey best practices [1] and consulting with the City Demographer [2]. Below are the results of this analysis:
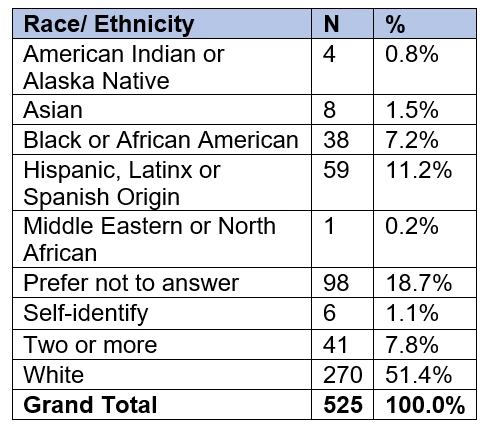
Race/ethnicity:
- 51% of respondents identified as White.
- 11% of respondents identified as Hispanic, Latinx, or Spanish.
- 7% of respondents identified as Black or African American.
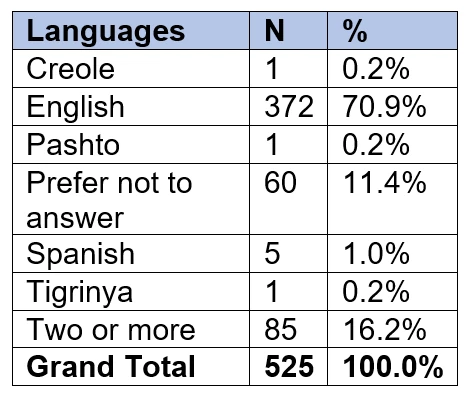
Language(s) spoken at home:
- 71% of respondents said they speak English at home.
- 16% of respondents said they speak two or more languages at home.
- 1% of respondents said they speak only Spanish at home.
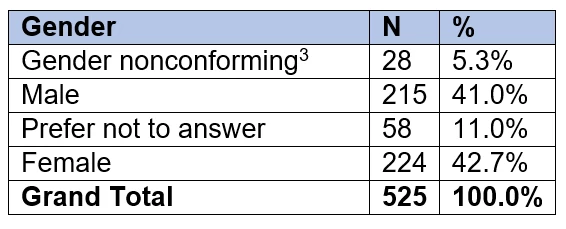
Gender identity:
- 43% of the respondents self-identified as female.
- 41% of respondents self-identified as male.
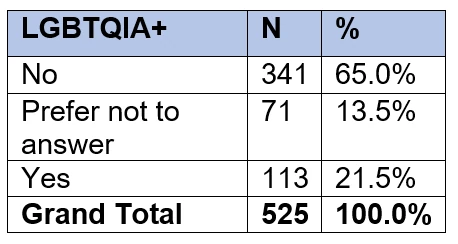
LGBTQIA+ identity:
- 22% of respondents identified as members of the LGBTQIA+ community.
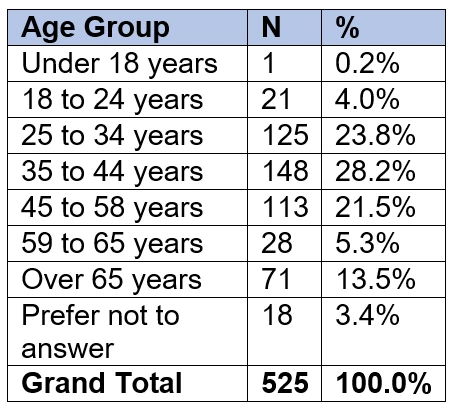
Age:
- The average age of respondents was 45 years.
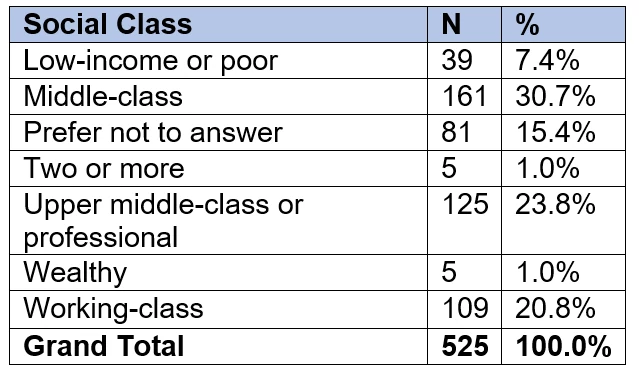
Social class:
- 55% of respondents identified as middle class or upper middle-class.
- 7% of respondents identified as low-income or poor.
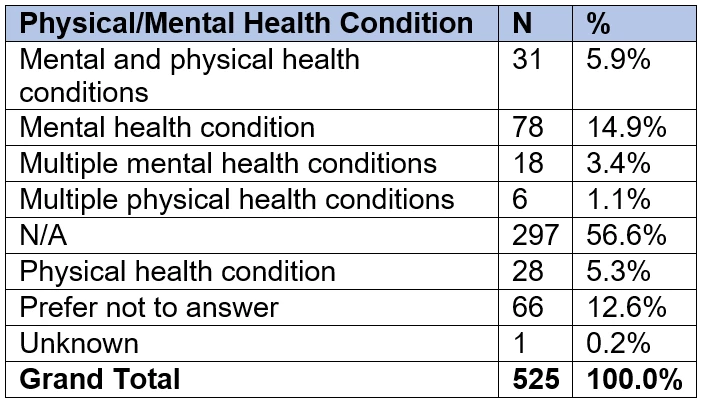
Physical and mental health conditions:
- 33% of respondents reported having a physical or mental health condition.
- Of the respondents who identified as having a physical or mental health condition, 73% of respondents reported having one or more mental health conditions.
- Of the respondents who identified as having a physical or mental health condition, 18% of respondents reported having both a mental and physical health condition.
Residential and employment ZIP codes:
- The largest percentage of survey respondents (9%) reported living in the 78745 ZIP code (Southwest Austin).
- The largest percentage of survey respondents (15%) reported working in the 78701 ZIP code (Central Austin).
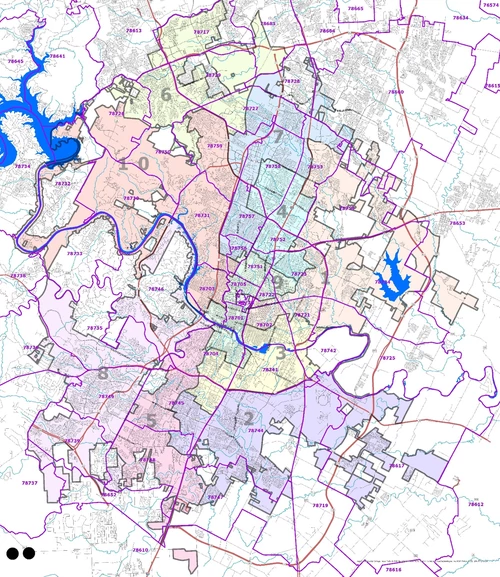
Map of Austin showing ZIP codes and council districts. (Source: City of Austin Housing and Planning Department).